Introduction
In the past three decades, the finite element (FE) method has become an increasingly useful tool for the prediction of stress effect on the implant and its surrounding bone, especially in the field of implant dentistry, & with more accurate computer simulation and modeling technologies, it has interested dental researchers even further. The FE method involves cutting a structure into several smaller pieces to describe the behaviour of each element in a simplified way & then reconnecting them at nodal points. Using associative functions like stress & deformation, the mechanical behaviour of these elements can be numerically studied.1, 2
Orthodontics in its century of existence have had a lot of landmarks in its evolution, but very few can match the clinical impact made by micro-implants & the recently introduced infra-zygomatic crest (IZC) and buccal shelf (BS) orthodontic bone screws. Micro-implants and extra-radicular bone screws have brought about a renaissance to the field of orthodontics with its concept of absolute anchorage in the past decade. It is an added armamentarium in the hands of an experienced clinician to overcome new clinical challenges & convert even borderline surgical cases to nonsurgical without, compromising with the results achieved. They have not only been able to solve the problems related to anchorage but also microimplant-mediated segmental distalization or full arch distalization with extra-radicular bone screws have been able to treat cases the non-extraction way or even retreat cases with anchorage loss.3
To achieve ideal treatment objectives, anchorage demand needs to be assessed in vertical, transverse, and anteroposterior planes. There are clinical challenges inherent in evaluating stress levels in bone & miniimplant of patients, making it difficult to interpret stress patterns that are generated. To address these limitations, researchers have used the finite element analysis engineering tool. Living structure stress/strain patterns can be studied accurately using the finite element method. Complex structures can be geometrically modelled noninvasively using FEM for stress & strain analysis. Von Mises stress values can be evaluated on these simulated models, as it determines if the given material will yield or fracture under complex loading conditions. The configuration and positioning of the MI can be optimized by carefully evaluating patterns of stress distribution along the MI and bone, helping to reduce failures. Although stress distribution around the MI has been analysed by several researchers previously, analysis of specific stress distribution patterns in implants placed in the buccal shelf region in different angulation has not been evaluated which will co-relate the loading force level and angulation determining the most suitable implant angulation and retraction forces.
Hence, the purpose of this finite element study was to estimate the stress in various structures (buccal shelf area and MI itself) when a buccal shelf screw is subjected to varying loads. This will help to determine an ideal angulation of an MI that can be loaded safely with an optimal orthodontic force to achieve adequate primary stability, and thus reduce the failure of MI in orthodontics.
Material and Methods
This study was conducted in the Department of Orthodontics and Dentofacial Orthopaedics, Divya Jyoti College of Dental Sciences and Research, with technical assistance from Indian Institute of Technology, Delhi.
CBCT scan of normal adult skull without any skeletal defects, trauma, lesions etc and with full complement of teeth up to 2nd molar except first premolar were obtained from the archives of a reputed CBCT scan Centre. Sequential CT images were acquired at 0.5 to 1 mm intervals in the axial direction, parallel to the Frankfort plane. A 3D CAD model was developed employing Mimics software. The CAD (Computer aided designing) model with proper details about the mandible was obtained with given material properties as shown in Table 2. The obtained CAD model was used to construct the geometric model of the tooth with the bonded brackets in Geomagic Modelling Software 2020. The X-ray & Scanning Data was obtained as *.STL format form the Scanning Centre. This Scanned Data was then imported into Altair Hyper Mesh Software 2020. Imported Data was the CAD Model used for this FE Simulation. The CAD Model was converted into Finite Element Model of Meshing or Mesh generation with meshing detail as shown in Table 1. Tetrahedron Elements were created on this CAD Model in order to convert it to FE Model. Mesh was generated using Altair Hyper Mesh Software 2020.
Table 1
Meshing details
|
Component |
No. of Nodes |
No. of elements |
|
Teet |
207148 |
1072185 |
|
Mandible & Alveolar bone |
138225 |
680737 |
|
Implant |
7172 |
5723 |
Table 2
Meshing details material properties
|
Component/Material |
Young’s modulus (N/mm2) |
Poisson’s ratio |
|
Teeth |
20300 |
0.30 |
|
Periodontal Ligament (PDL) |
50.1 |
0.49 |
|
Mandible & Alveolar bone |
13700 |
0.30 |
|
Implant |
110000 |
0.35 |
Table 3
Material properties
|
Force (grams) |
Stress on Implant |
Stress in Mandible |
|
150 grams |
3.017 MPA |
1.480 MPA |
|
200 grams |
3.772 MPA |
1.850 MPA |
|
250 grams |
4.883 MPA |
2.379 MPA |
|
300 grams |
5.016 MPA |
2.469 MPA |
To simulate loading conditions, orthodontic forces of magnitudes 150, 200, 250 & 300 grams of force were applied over the head of the MI in a horizontal direction. On application of variable loads at different MI angulations (40, 50, 60, 70, 90 degree) Von Mises stresses were evaluated in both bone and buccal shelf screws for each of the simulated models.
Table 4
Von Mises stresses on implant and in mandible for 90-degree angulation
|
Force (grams) |
Stress on Implant |
Stress in Mandible |
|
150 grams |
3.017 MPA |
1.480 MPA |
|
200 grams |
3.772 MPA |
1.850 MPA |
|
250 grams |
4.883 MPA |
2.379 MPA |
|
300 grams |
5.016 MPA |
2.469 MPA |
Table 5
Von Mises stresses on implant and in mandible for 70-degree angulation
|
Force (grams) |
Stress on Implant |
Stress in Mandible |
|
150 grams |
2.810 MPA |
1.083 MPA |
|
200 grams |
3.679 MPA |
1.422 MPA |
|
250 grams |
6.017 MPA |
1.761 MPA |
|
300 grams |
6.155 MPA |
2.312 MPA |
Table 6
Von Mises stresses on implant and in mandible for 60-degree angulation
|
Force (grams) |
Stress on Implant |
Stress in Mandible |
|
150 grams |
1.818 MPA |
1.161 MPA |
|
200 grams |
2.361 MPA |
1.623 MPA |
|
250 grams |
2.642 MPA |
1.914 MPA |
|
300 grams |
3.118 MPA |
2.358 MPA |
Table 7
Von Mises stresses on implant and in mandible for 50-degree angulation
|
Force (grams) |
Stress on Implant |
Stress in Mandible |
|
150 grams |
5.573 MPA |
1.816 MPA |
|
200 grams |
7.759 MPA |
2.516 MPA |
|
250 grams |
8.954 MPA |
2.93 MPA |
|
300 grams |
11.202 MPA |
3.675 MPA |
Table 8
Von Mises stresses on implant and in mandible for 40-degree angulation
|
Force (grams) |
Stress on Implant |
Stress in Mandible |
|
150 grams |
3.072 MPA |
1.208 MPA |
|
200 grams |
5.121 MPA |
2.077 MPA |
|
250 grams |
9.016 MPA |
3.468 MPA |
|
300 grams |
12.323 MPA |
4.824 MPA |
Table 9
Intergroup comparison between different angulation for stress in implants
|
|
Sum of Squares |
df |
Mean Square |
F |
Sig. |
|
Between Groups |
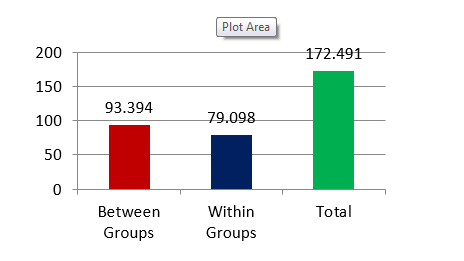
93.394 |
4 |
23.348 |
4.428 |
.015 |
|
Within Groups |
79.098 |
15 |
5.273 |
||
|
Total |
172.491 |
19 |
|
Table 10
One way ANOVA table showing sum of squares between and within group
Results
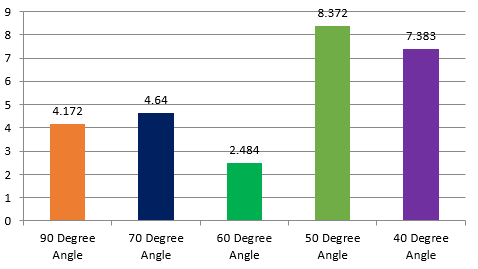
Comparing stresses in implant for different angulation using One Way ANOVA test & mean value showed 60-degree angle has least Von Mises stresses which gradually increased from 70-degree angle to 90-degree angle, but 50 and 40 degree showed greater stress distribution pattern in implant as shown in Table 8, Table 9. The maximum and minimum von Mises stresses were observed at 50 and 60 degree respectively. The above result is statistically non-significant same as shown in Figure 9.
Table 11
Post Hoc Analysis showing mean differences between group
Table 12
One Way ANOVA table showing sum of squares between and within group
|
|
Sum of Squares |
df |
Mean Square |
F |
Sig. |
|
Between Groups |
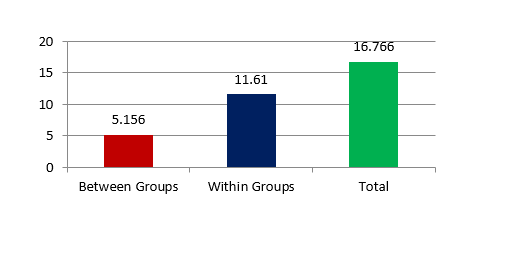
5.156 |
4 |
1.289 |
1.665 |
.210 |
|
Within Groups |
11.610 |
15 |
.774 |
||
|
Total |
16.766 |
19 |
Comparison between group using post hoc analysis showed 900 vs 500 , 700 vs 500, 600 vs 500 and 600 vs 400 had result which were statistically significant meaning stress gradually increased between 60 ,70 , and 90 degree but stress greatly increased below 60 degree which is for 50 and 40 degree which are shown in Table 10 Figure 10 Mean difference for 600 vs 500 was the least (-5.887) showing the maximum and minimum von Mises stresses were observed at 50 and 60 degree respectively.
Table 13
One Way ANOVA table showing sum of squares between and within group
|
|
Sum of Squares |
df |
Mean Square |
F |
Sig. |
|
Between Groups |
5.156 |
4 |
1.289 |
1.665 |
.210 |
|
Within Groups |
11.610 |
15 |
.774 |
||
|
Total |
16.766 |
19 |
|
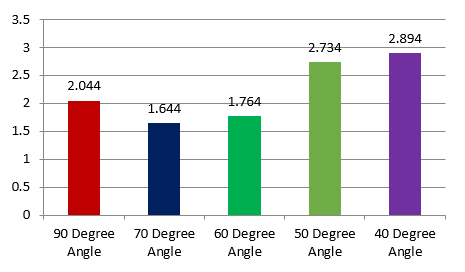
Comparing stresses in mandible for different angulation using One Way ANOVA test and mean value showed 70-degree angle has least Von Mises stresses which gradually increased between 60-degree angle and 90-degree angle, but 50 and 40 degree showed greater stress distribution pattern in implant as shown in Table 11, Table 12. The maximum and minimum von Mises stresses were observed at 40 and 70 degree respectively. The above result is statistically non-significant same as shown in Figure 11
Table 14
Post Hoc Analysis showing mean differences between groups
Comparison between group using post hoc analysis showed every inter group result were statistically non-significant meaning von misses stress gradually increased between 70, 60, and 90 degree and stress greatly increased below 60 degree which is for 50 and 40 degree but did not show any statistical significance which are shown in Table 13 & Figure 12. Mean difference for 700 vs 400 was the least (-1.249) showing the maximum and minimum von Mises stresses were observed at 40 and 70 degree respectively.
Thus, concluding the results:
In the buccal shelf screws showed maximal & minimal von Mises stress at 500 and 600 angulations at all four forces respectively which are shown in Table 5, Table 6.
In the mandible showed maximal and minimal von Mises stress at 400 and 700 angulations at all four forces respectively which are shown in Table 4, Table 7.
Co-relating the loading force level and angulation in order to determine the most suitable implant angulation, it was seen between 700 & 600 suitable for both the implant and mandible
500 and 400 angulations are contraindicated since it can lead to implant failure and anchorage loss.
Discussion
Early work in this area of orthodontics focused on the development of crude 2D models using existing information on the physical properties of dry/wet bone and other tissues. Inevitably, the validation systems were very limited in scope. Since that time, three-dimensional FEM models of the tooth, periodontal ligament, and bone continuum have been described, a recent example being the work of Nyashing and co-workers. The finite-element method was first used in medical orthopaedics but was later introduced in other specialties, such as orthodontics. The first FEM described the tooth-bone structure two-dimensionally, using average geometric relationships and homogeneous and isotropic material models. Three-dimensional, FEM were first published in 1973. Since then, increased interest has produced a number of papers on 3D models."
Looking forward for the first objective that is von mises stress pattern, it was found that implant when placed in buccal shelf area between 700- 600 least stress was observed so it is the ideal angulation which will reduce bone distortion, loss of anchorage & stability of implant. On the other hand maximal stress was observed between 500 to 400 angulation on both bone screw & mandible thus contraindicating this angle as it can lead to implant failures. Katheesa Parveen4 mentioned in her article the driving of the buccal shelf screws into the bone begins 14-16mm below the mandibular occlusal plane at an angle of 90° to the occlusal plane. After a couple of turns, the mini-screws handle is turned to an angle of 55°to 70° to avoid damage to the roots of the molar teeth. An angle greater than 75° faces technical difficulty in placement, there might be slippage of buccal shelf screws, bone stripping and also there is a greater chance of damage to the mesiobuccal root of the molar. Keeping a note about the dimensions and material properties of implant, Miyawaki et al.5 found that instability and failure of titanium miniscrew implants placed in the buccal alveolar bone of the posterior region were associated with an implant thread diameter of 1.0 mm or less. Also Jenny Zwei-Chieng Chang6 showed in her study involving the finite element analyses & the mechanical testing of different mini-implant designs, the results demonstrated that, for a mini-implant with a fixed external diameter of 2 mm, a thread length of 9.82 mm, and a pitch of 0.75 mm, the mini-implant performed better with a core/external diameter ratio of 0.68. Increasing the core diameter of the uppermost threads to create a tapered core deign could reduce the stress concentration effects at the neck while improving the pullout resistance concluding that implant design also affects the stability & stress distribution to the underlying bone. In this present study thread diameter is 2mm, thread angle is 900, 8 mm pitch length, 2mm diameter of screw and 12mm implant length which all increased the implant stability within the bone thus reducing the failure rate. According to Singh K, Kumar D7 the materials used for the manufacturing of these temporary anchorage device can be divided into three categories: bio tolerant (stainless steel, chromium–cobalt alloy), bioinert (titanium, carbon) & bioactive (hydroxyapatite, ceramic oxidized aluminum). He advised using an alloy of titanium that is titanium-6 aluminum-4 vanadium is used in the manufacturing of temporary anchorage device, same material properties were opted for the bone screws in this study. Considering the bone density, according to Tina Chugh and Abhay Kumar Jain.8 knowledge of low-density sites prior to implant placement allows clinician to use longer implant in these areas to improve retention. Immediate loading of mini implants is possible because of higher bone density in all the areas of cortical bone. In this current study mandible & alveolar bone was given 13700 Young’s modulus (N/mm2) & Poisson’s ratio of 0.30 which shows bone density of D2 which was similar the other authors study. Biavati AS9 mentioned implant core should penetrate bone to a depth of at least 5 mm in the mandible and 6 mm in the maxilla in order to guarantee stability over the whole period necessary for dental movements. Concluding that at least 71.2% of the screw length should penetrate alveolar bone, particularly in the maxilla, where this percentage may need to be even higher. In this study out of total length of the implant 75% of the screw was penetrated in the buccal shelf bone. Placement of bone screw in this current study was done 2mm below the mucogingival junction with angle between 600 to 700 bypassing the roots of the teeth and directing the screw to the buccal shelf area. According to Tarek Elshebiny, Juan Martin Palomo & Sebastian Baumgaertel10 cortical bone thickness, buccal shelf bone width, & insertion depth appear to be the most favorable sites which is buccal to the 2nd molar for insertion of buccal shelf screws. The same was found by Haibo Liu11 who conducted an analysis of cone beam computed tomography images showing the region between the mandibular 1st & 2nd molars (l6db– l7mb) should be the first choice for minisrew implantation in the buccal alveolar bone in the mandibular buccal shelf for the distalization of the entire mandibular dentition. According to Abhishek Ghosh12 the preferred site for placement of bone screws in the mandible is the buccal shelf area, which lies lower and lateral to the 2nd molar region. Buccal shelf BS can also be placed in the external oblique ridge of the mandible if the buccal shelf area is found to be too thin or too deep, as is so commonly seen in the Indian population.
This study had certain technical constraints with respect to accurate model construction, which are universal to FEM studies. It was presumed that both cortical & cancellous bone were homogeneous, linearly elastic, and isotropic. However, they are neither homogeneous nor isotropic. These assumptions were made for convenience & to compensate for the lack of knowledge about bone tissues and their behavior. Moreover, bone block geometry was made simple, & soft tissue simulation was not performed. With our current knowledge, it is difficult to exactly predict changes that could occur over a period under the same loading conditions. Stress transfer in the neighboring structures, such as roots of the teeth, should be included in future studies. Therefore, this study is a predictive analysis & must be used as a reference to aid judgment in clinical situations. Further clinical studies could be planned by using the same protocol of miniscrew insertion on a multicentric sample. Additional research with improved FEM software will help to create more accurate 3D models to simulate clinical scenarios & aid robust clinical evidence for bone screws placement in the mandibular buccal shelf area.
Conclusion
So, in this study evaluation of Von Mises stress distribution pattern on implant & in mandibular buccal shelf area was done using 3D Finite Element method. A FE modeled buccal shelf screw of dimensions 2*12 mm was placed between first & second molar region in different angulation 900, 700, 600, 500, 400. Then each angle was subjected to varying retraction force levels of 150, 200, 250 & 300 grams using finite element simulations to analyze the stress pattern around the implant & the bone present in the buccal shelf area & this will allow the clinician to achieve the treatment objective without any implant failure & absolute anchorage. Thus, concluding the results of the study it was found that:
The aim of any new clinical protocol is to improve the quality of treatment delivered together with the addition of precision, broadening the horizons of treatment, and improve the compliance factor for both the patient and the clinician, & this is the same with orthodontic bone screws. The orthodontic treatment techniques with these extra radicular bone screws when used judiciously could help in overcoming newer challenges & go beyond boundaries in achieving the ultimate goal of — “Clinical Excellence.”


