- Visibility 108 Views
- Downloads 19 Downloads
- DOI 10.18231/j.jco.2022.020
-
CrossMark

Cephalometric norms in coastal Odisha children
Introduction
The growth of the cranial base has been accepted to play a major role in influencing the maxillofacial growth, Thus, there is possibility that any changes in cranial base orientation may influence the sagittal malposition of jaws resulting in facial disharmony.[1]
Anthropological research studies indicate that each racial group has its own standards. Hence it is not possible to apply the same cephalometric standards to all races. The norm concept occupies a prominent place to clarify problems relating to diagnosis and treatment.[2], [3]
Although patients seeking orthodontic treatment range from very young to adults but it is the children who form the bulk of the orthodontic patients. So, keeping in mind the targeted age group priority should be given to obtain the solid cephalometric norm for children in the 9-16-year age group.
Cephalometric norms have been established using various analysis for the different strata of Indian population.[4], [5], [6], [7], [8], [9], [10], [11], [12], [13], [14] Since no anthropometric investigations were conducted in the population of Odisha, this study established a cephalometric norm for the Odia Population which would act as a data base for all future reference.
|
Parameters |
Total Sample (N=60) |
Male 9-12 Years (N=15) |
Female 9-12 Years (N=15) |
Signifi- cance |
Male 13-16 Years (N=14) |
Female 13-16 Years (N=16) |
Significance |
|||||
|
Mean |
SD |
Mean |
SD |
Mean |
SD |
Mean |
SD |
Mean |
SD |
|||
|
N-S |
55.07 |
2.16 |
55.67 |
2.45 |
54.03 |
1.98 |
* |
55.07 |
2.01 |
55.47 |
2.02 |
NS |
|
S-Ba |
36.97 |
2.46 |
37.17 |
2.42 |
36.67 |
1.54 |
NS |
37.82 |
3.49 |
36.34 |
2.09 |
NS |
|
<N-S-Ar |
125.00 |
5.73 |
124.27 |
6.20 |
123.67 |
5.54 |
NS |
124.64 |
4.14 |
127.25 |
6.45 |
NS |
|
<S-Ar-Go |
138.97 |
7.08 |
140.40 |
5.73 |
139.67 |
9.19 |
NS |
138.29 |
4.18 |
137.56 |
8.23 |
NS |
|
Ar-Ptm |
28.32 |
2.18 |
27.40 |
1.71 |
28.43 |
3.10 |
NS |
29.07 |
1.36 |
28.41 |
2.00 |
NS |
|
Ptm-N |
39.68 |
2.55 |
40.57 |
2.70 |
37.77 |
1.72 |
** |
40.00 |
2.72 |
40.37 |
2.15 |
NS |
|
Parameters |
Total Sample (N=60) |
Male 9-12 YEARS (N=15) |
Female 9-12 YEARS (N=15) |
Signifi- cance |
Male 13-16 YEARS (N=14) |
Female 13-16 YEARS (N=16) |
Significance |
|||||
|
Mean |
SD |
Mean |
SD |
Mean |
SD |
Mean |
SD |
Mean |
SD |
|||
|
< SNA |
82.68 |
3.62 |
81.40 |
3.92 |
83.20 |
4.04 |
NS |
82.61 |
2.24 |
83.47 |
3.88 |
NS |
|
N to A on HP |
0.44 |
3.05 |
1.37 |
3.19 |
0.10 |
3.49 |
NS |
0.39 |
2.31 |
-0.06 |
3.14 |
NS |
|
RMFL |
67.76 |
3.19 |
67.00 |
3.84 |
66.10 |
2.83 |
NS |
68.64 |
2.40 |
69.25 |
2.74 |
NS |
|
EPL |
43.28 |
3.67 |
43.77 |
3.24 |
42.03 |
2.47 |
NS |
43.25 |
4.02 |
44.03 |
4.60 |
NS |
|
N-ANS(HP) |
40.56 |
2.36 |
39.77 |
1.54 |
39.40 |
2.10 |
NS |
42.54 |
1.78 |
40.66 |
2.70 |
* |
|
N-PNS (HP) |
40.71 |
3.05 |
39.93 |
2.44 |
39.87 |
2.93 |
NS |
42.54 |
3.67 |
40.62 |
2.64 |
NS |
|
Parameters |
Total Sample (N=60) |
Male 9-12 Years (N=15) |
Female 9-12 Years (N=15) |
Significance |
Male 13-16 Years (N=14) |
Female 13-16 Years (N=16) |
Significance |
|||||
|
Mean |
SD |
Mean |
SD |
Mean |
SD |
Mean |
SD |
Mean |
SD |
|||
|
<U1 to NA |
24.63 |
4.86 |
24.80 |
4.57 |
23.73 |
5.02 |
NS |
28.00 |
5.26 |
22.37 |
3.01 |
*** |
|
U1 to NA |
3.58 |
1.70 |
3.43 |
1.19 |
3.33 |
2.52 |
NS |
4.11 |
1.61 |
3.50 |
1.25 |
NS |
|
<U1 to A- vertical |
3.14 |
1.89 |
2.63 |
1.56 |
3.23 |
2.66 |
NS |
3.21 |
1.29 |
3.47 |
1.83 |
NS |
|
<U1 to A-Pog |
5.50 |
1.83 |
6.20 |
1.61 |
5.07 |
2.10 |
NS |
5.29 |
1.17 |
5.44 |
2.17 |
NS |
|
<U1 to SN plane |
108.33 |
6.60 |
106.63 |
5.89 |
108.53 |
8.89 |
NS |
112.14 |
5.20 |
106.41 |
4.59 |
** |
|
<U1 to PP |
65.30 |
5.77 |
66.57 |
6.36 |
65.80 |
7.21 |
NS |
61.75 |
4.47 |
66.75 |
3.36 |
** |
|
U6 to Ptv |
11.94 |
3.26 |
11.13 |
2.97 |
11.13 |
2.66 |
NS |
13.14 |
2.39 |
12.41 |
4.36 |
NS |
|
U1 to NF |
24.76 |
2.48 |
25.33 |
2.78 |
23.60 |
1.84 |
NS |
25.61 |
1.72 |
24.56 |
2.98 |
NS |
|
U6 to NF |
18.67 |
1.76 |
18.43 |
1.82 |
17.73 |
1.12 |
NS |
19.43 |
1.86 |
19.09 |
1.81 |
NS |
|
Parameters |
Total sample (n=60) |
Male 9-12 years (n=15) |
Female 9-12 years (n=15) |
Signifi- cance |
Male 13-16 years (n=14) |
Female 13-16 years (n=16) |
Significance |
|||||
|
Mean |
SD |
Mean |
SD |
Mean |
SD |
Mean |
SD |
Mean |
SD |
|||
|
<SNB |
79.43 |
3.48 |
77.47 |
2.77 |
80.57 |
4.59 |
* |
79.79 |
2.26 |
79.91 |
3.29 |
NS |
|
N to Pog |
-3.12 |
4.79 |
-4.37 |
6.55 |
-2.17 |
5.37 |
NS |
-3.29 |
2.78 |
-2.72 |
3.75 |
NS |
|
RMndL |
81.58 |
4.28 |
79.70 |
4.77 |
80.77 |
5.23 |
NS |
82.32 |
3.20 |
83.47 |
2.81 |
NS |
|
Go-Pog |
57.32 |
3.17 |
55.57 |
3.60 |
56.87 |
3.05 |
NS |
57.96 |
2.66 |
58.81 |
2.55 |
NS |
|
B-Pog |
3.87 |
1.16 |
3.63 |
1.25 |
4.07 |
0.92 |
NS |
4.07 |
1.39 |
3.72 |
1.08 |
NS |
|
<MP -HP |
23.49 |
4.71 |
26.90 |
3.07 |
23.00 |
6.14 |
* |
21.36 |
3.29 |
22.62 |
4.13 |
NS |
|
<FMA |
26.24 |
4.09 |
28.00 |
4.00 |
26.13 |
4.73 |
NS |
25.07 |
2.73 |
25.72 |
4.34 |
NS |
|
<SN- GoGn |
30.49 |
4.71 |
33.90 |
3.07 |
30.00 |
6.14 |
* |
28.36 |
3.29 |
29.62 |
4.13 |
NS |
|
Ar-Go length |
34.54 |
3.30 |
32.90 |
2.74 |
34.13 |
4.50 |
NS |
35.43 |
2.47 |
35.69 |
2.61 |
NS |
|
<Ar-Go-N |
55.19 |
3.43 |
56.03 |
1.95 |
55.33 |
3.72 |
NS |
54.43 |
2.10 |
54.94 |
4.96 |
NS |
|
<N-Go-Gn |
71.01 |
3.22 |
73.17 |
2.75 |
71.13 |
3.72 |
NS |
69.79 |
2.33 |
69.94 |
2.98 |
NS |
|
Total gonial angle |
126.20 |
4.85 |
129.20 |
3.55 |
126.47 |
4.66 |
NS |
124.21 |
2.55 |
124.88 |
6.33 |
NS |
|
Parameters |
Total sample (n=60) |
Male 9-12 years (n=15) |
Female 9-12 years (n=15) |
Signifi- cance |
Male 13-16 years (n=14) |
Female 13-16 years (n=16) |
Significance |
|||||
|
Mean |
SD |
Mean |
SD |
Mean |
SD |
Mean |
SD |
Mean |
SD |
|||
|
<L1 to NB |
28.67 |
5.27 |
29.07 |
4.25 |
29.43 |
4.71 |
NS |
28.82 |
6.01 |
27.47 |
6.19 |
NS |
|
L1 to NB |
5.21 |
1.74 |
5.90 |
1.48 |
4.97 |
2.06 |
NS |
5.04 |
1.34 |
4.94 |
1.94 |
NS |
|
<L1 to MP |
96.58 |
5.86 |
96.40 |
5.09 |
95.80 |
4.09 |
NS |
98.89 |
7.03 |
95.47 |
6.74 |
NS |
|
<L1 to A-Pog |
25.60 |
4.12 |
25.10 |
3.37 |
26.50 |
3.90 |
NS |
26.64 |
5.35 |
24.31 |
3.65 |
NS |
|
L1 to A-Pog |
2.51 |
1.66 |
3.03 |
1.23 |
2.63 |
1.92 |
NS |
1.89 |
1.81 |
2.44 |
1.57 |
NS |
|
L1 to MP |
28.79 |
2.11 |
29.30 |
2.30 |
27.83 |
1.79 |
NS |
29.18 |
1.54 |
28.87 |
2.47 |
NS |
|
L6 to MP |
22.07 |
1.94 |
21.97 |
1.96 |
21.23 |
1.28 |
NS |
23.25 |
1.57 |
21.91 |
2.35 |
NS |
|
Parameters |
Total sample (n=60) |
Male 9-12 years (n=15) |
Female 9-12 years (n=15) |
Signifi- cance |
Male 13-16 years (n=14) |
Female 13-16 years (n=16) |
Significance |
|||||
|
Mean |
SD |
Mean |
SD |
Mean |
SD |
Mean |
SD |
Mean |
SD |
|||
|
WITS |
-1.00 |
2.17 |
-1.53 |
1.87 |
0.33 |
2.58 |
* |
-1.43 |
1.44 |
-1.37 |
2.19 |
NS |
|
<ANB |
3.35 |
2.06 |
3.93 |
1.98 |
3.03 |
2.38 |
NS |
2.82 |
1.70 |
3.56 |
2.11 |
NS |
|
M-M |
13.66 |
2.60 |
12.70 |
2.43 |
14.00 |
2.88 |
NS |
13.68 |
2.41 |
14.22 |
2.65 |
NS |
|
ANS-Gn |
46.18 |
3.57 |
47.27 |
4.59 |
44.87 |
2.45 |
NS |
45.89 |
2.69 |
46.66 |
3.92 |
NS |
|
Angle of convexity |
5.79 |
3.80 |
6.93 |
3.24 |
5.40 |
3.46 |
NS |
4.93 |
3.95 |
5.84 |
4.49 |
NS |
|
Y- axis |
60.22 |
3.97 |
61.60 |
4.19 |
59.13 |
3.40 |
NS |
61.21 |
3.91 |
59.06 |
4.01 |
NS |
|
Jarabak ratio |
0.67 |
0.04 |
0.63 |
0.03 |
0.67 |
0.05 |
* |
0.69 |
0.03 |
0.67 |
0.03 |
* |
|
AUFH/ALFH |
0.81 |
0.07 |
0.78 |
0.07 |
0.82 |
0.05 |
NS |
0.85 |
0.08 |
0.81 |
0.06 |
NS |
|
Bjorks sum |
390.17 |
4.66 |
393.87 |
3.34 |
389.80 |
5.63 |
* |
387.14 |
3.28 |
389.69 |
3.66 |
* |
|
<PP - MP |
22.82 |
5.12 |
23.87 |
5.87 |
23.47 |
5.36 |
NS |
22.04 |
3.88 |
21.94 |
5.32 |
NS |
|
Interincisal angle |
123.13 |
9.10 |
122.13 |
8.48 |
124.20 |
7.83 |
NS |
118.79 |
10.32 |
126.87 |
8.60 |
* |
|
Parameters |
Total sample (n=60) |
Male 9-12 years (n=15) |
Female 9-12 years (n=15) |
Signifi- cance |
Male 13-16 years (n=14) |
Female 13-16 years (n=16) |
Significance |
|||||
|
Mean |
SD |
Mean |
SD |
Mean |
SD |
Mean |
SD |
MEAN |
SD |
|||
|
NFA |
35.77 |
3.15 |
37.27 |
3.61 |
34.73 |
2.52 |
* |
35.14 |
2.14 |
35.87 |
3.65 |
NS |
|
NLA |
111.50 |
9.19 |
112.13 |
9.41 |
113.27 |
8.78 |
NS |
109.00 |
9.00 |
111.44 |
9.89 |
NS |
|
NMA |
125.78 |
4.44 |
125.07 |
5.02 |
127.20 |
4.23 |
NS |
125.64 |
3.54 |
125.22 |
4.85 |
NS |
|
MCA |
112.13 |
4.99 |
112.33 |
5.96 |
110.67 |
3.44 |
NS |
112.71 |
5.57 |
112.81 |
4.89 |
NS |
|
SMNA |
117.73 |
8.16 |
115.07 |
10.54 |
118.00 |
7.33 |
NS |
117.43 |
5.47 |
120.25 |
8.27 |
NS |
|
UL/LL |
0.49 |
0.04 |
0.49 |
0.03 |
0.47 |
0.05 |
NS |
0.50 |
0.02 |
0.48 |
0.04 |
NS |
|
MAX.PM |
4.43 |
3.36 |
2.47 |
2.63 |
4.37 |
4.06 |
NS |
5.39 |
2.43 |
5.50 |
3.39 |
NS |
|
MAND.PM |
-1.83 |
3.95 |
-3.27 |
2.03 |
-0.47 |
5.36 |
NS |
-2.43 |
3.34 |
-1.25 |
4.04 |
NS |
|
ULP |
3.70 |
1.57 |
4.07 |
1.59 |
3.07 |
1.61 |
NS |
4.61 |
1.61 |
3.16 |
1.03 |
** |
|
LLP |
3.07 |
1.70 |
3.53 |
1.64 |
3.27 |
1.69 |
NS |
3.57 |
1.68 |
2.03 |
1.44 |
* |
|
UL-E |
-1.02 |
2.30 |
-0.83 |
2.18 |
-1.67 |
2.60 |
NS |
0.00 |
1.92 |
-1.47 |
2.29 |
NS |
|
LL-E |
1.12 |
2.26 |
1.37 |
2.08 |
1.07 |
1.93 |
NS |
1.96 |
2.42 |
0.22 |
2.44 |
NS |
|
ULT |
10.73 |
1.52 |
10.30 |
1.22 |
9.90 |
1.68 |
NS |
11.00 |
0.92 |
11.69 |
1.54 |
NS |
|
ULS |
10.33 |
1.65 |
10.17 |
1.58 |
9.07 |
1.49 |
NS |
11.32 |
1.73 |
10.81 |
0.96 |
NS |


Materials and Methods
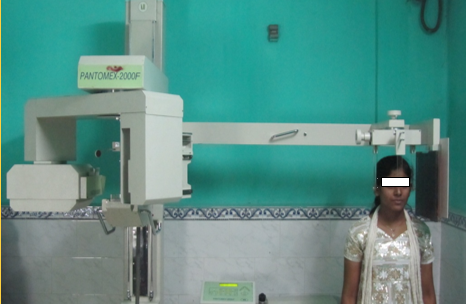
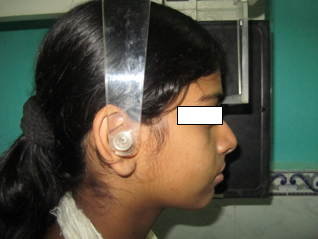
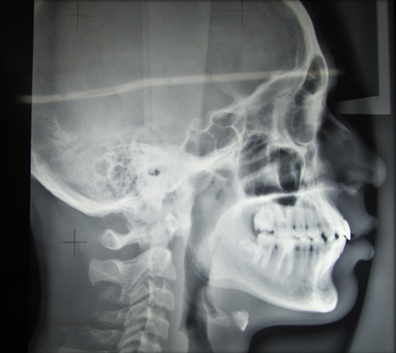
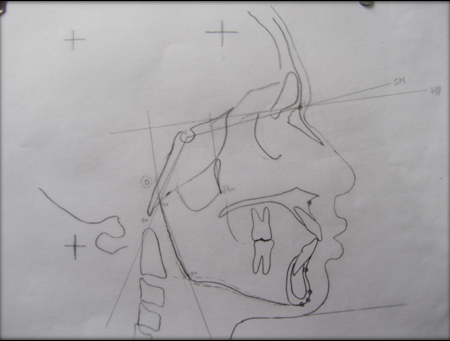
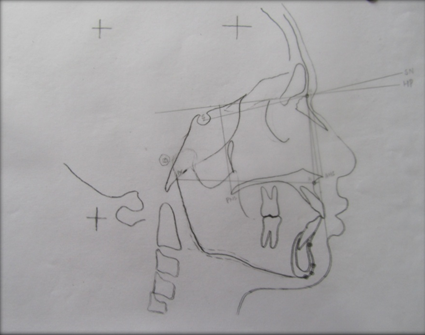
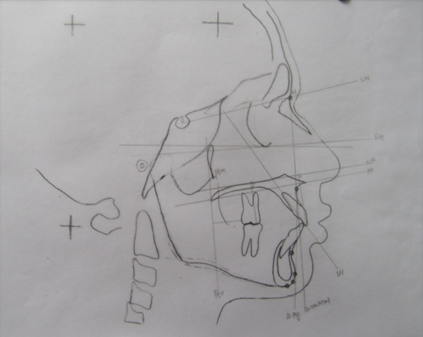
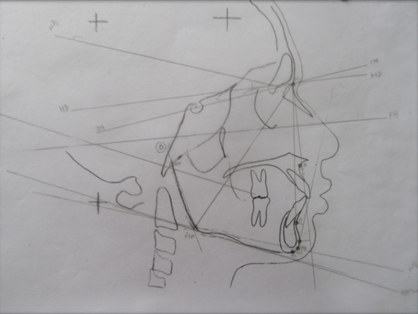
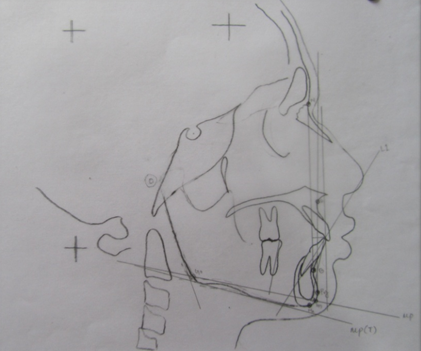
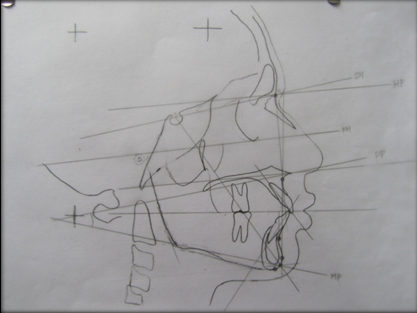
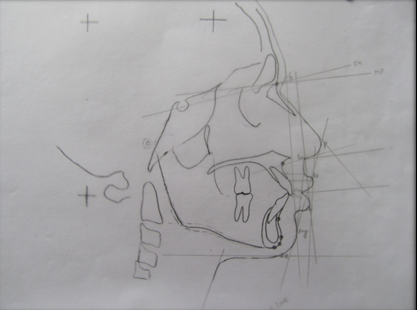
After ethical committee approval, a total of 60 lateral cephalometric radiographs of coastal odisha children (males-29, females-31; aged 9-16 years) with balanced and acceptable facial profile, normal overjet and overbite, class I skeletal and dental relationship, and no previous orthodontic treatment were selected as sample which were further subdivided into two groups according to age i.e from 9 to 12 years (M-15, F-15) and 13 to 16 years (M-14, F-16). All the selected subjects were native of coastal Odisha. The Lateral Cephalometric Radiographs of all the subjects were Standardized in one machine Pantomex-2000F ([Figure 1], [Figure 2]). The cephalometric landmarks were traced and analysed by a single examiner to eliminate possible errors ([Figure 3], [Figure 4], [Figure 5], [Figure 6], [Figure 7], [Figure 8], [Figure 9], [Figure 10]).
Different angular and linear parameters were obtained and grouped under 7 categories as follows.
Cranial base
Skeletal maxillae
Dentoalveolar maxilla
Skeletal mandibles
Dentoalveolar mandible
Maxillomandibular relation
Soft tissue
Results
The data were subjected to statistical analysis using SPSS 13 version to obtain the mean and standard deviation for each parameter and are tabulated in [Table 1], [Table 2], [Table 3], [Table 4], [Table 5], [Table 6], [Table 7]. Independent sample t -tests were performed to compare Odia and Caucasians and to compare male and female groups.
Discussion
India is famous for its unity in diversity. A north Indian Kasmiri has very different facial pattern than a south Indian Tamil or a northeast Assamese. This mandates to have a set of cephalometric norms specific to that population of a region. Hence cephalometric norms have been established for the different strata of Indian population. Similarly, different racial groups worldwide have been studied for their cephalometric standards[15], [16], [17], [18], [19], [20], [21], [22], [23], [24], [25], [26]
Several established cephalometric norms accepted and followed by the researchers worldwide are Downs[27] (5skeletal and 5 dental), Steiner[28] (7 skeletal, 10 dental and 1 soft tissue), Tweed[29] (3skeletal), Ricketts [30] (4skeletal,3dental and 1soft tissue), McNammara [31] (8 skeletal, 2 dental and 1 soft tissue), Bjork [32] –Jarabak [33] (23 skeletal,7 dental and 2 soft tissue), Burstone [34] (15 skeletal and 9 dental). The current study contains 65 different parameters derived from various milestone analysis, so that wide range of facial skeletal and soft tissue norms grouped in a specific manner.
Cranial base
Any changes in cranial base orientation may influence the sagittal malposition of jaws resulting in facial disharmony.
The data obtained in reference to anterior cranial base length, posterior cranial base length, saddle angle, articular angle, Ar-Ptm and N-Ptm linear distance of Coastal Odia children were found to be statistically different (p<0.0001) when compared with the established norms for Caucasians.[33], [34] ([Figure 11] ). Similar findings were also observed in a study on Saudi population. [35]
It was observed that males in the age group of 9-12 years have a greater anterior cranial base length than the females in relation to N-S and Ptm-N linear distance which was consistent with the findings by Ursi et al.[36] and Trivedi et al.[37]
Skeletal maxilla
The parameters <SNA, N to A, relative midfacial length and effective palatal length reflect the anteroposterior dimensions of the maxillary basal bone and N-ANS and N-PNS represent the vertical dimensions of maxilla giving an overall idea of maxillary basal bone in both planes.
There was no significant intergender differences for the parameters <SNA and the linear distance of N to A, the relative maxillary length, effective palatal length. The only maxillary skeletal base parameter which shows significant (p=0.035) intergender difference in 13-16 year age group is N-ANS linear distance (i.e anterior vertical height of maxilla) where males have more anterior vertical maxillary height than females.
The linear parameters of the present study defining the structure and size of maxilla (Relative midfacial length, Effective palatal length, N-ANS and N-PNS linear distance) show highly statistically significant difference (p<0.001) when compared with Caucasians, who have higher degree of linear measurements irrespective of gender. Maxilla of Caucasians is larger in anteroposterior and vertical dimensions than Odia population.[Figure 12]
Dentoalveolar maxilla
The parameters U1 to NA, U1 to A vertical, U1 to A Pog, U1 to SN and U1 to palatal plane describes about the upper incisor inclinations. [38], [29], [30], [31], [32], [33] Similarly, upper molar anteroposterior positioning may be explained by the parameter U6 to Ptv. [31] Vertical positioning of maxillary teeth is represented by the parameters U1 to NF and U6 to NF. [35]
In the present study, U1 to NA (p<0.001) and U1 to SN (p<0.01) angular measurements are significantly higher in males than females and the U1 to palatal plane angular measurement was significantly less in males than females (p<0.05) in the 13-to-16-year age group indicating more upright incisors in adolescent Odia females. These findings are in agreement with the earlier study on central Indian population.[39]
The <U1 to A-vertical, <U1 to palatal plane, U1 to NF and U6 to NF parameters are lesser than Caucasians whereas<U1 to NA, <U1 to A-pog , <U1 to SN parameters are greater than the Caucasians (FIGURE 15).Thus the Odia population has more proclined upper incisors than the Caucasians. Similar observations were made by Syamkumar B et al.[13] (2009) and Mohammad HA et al.[40] (2011) in malay population.
U1 to NF and U6 to NF show that Odia children have smaller upper dental height in anterior and posterior region than Caucasians sample of Burstone.[35] [Figure 13]
Skeletal mandible
In the present study the parameters <SNB, N to Pog, Relative mandibular length, Go to Pog and B to Pog represents the anteroposterior positioning of the mandibular bone whereas <Mp-Hp, <FMA, <SN-GoGn, Ar-Go length and Gonial angle explains the vertical dimension of the mandible.
In the present study, <SNB showed significant(p<0.05) sexual dimorphism in 9-12yr age group which signifies that in males of this age group mandible is more posteriorly positioned with respect to cranium than females but <SNA does not show the same trend. This can be explained by the fact that mandibular growth resembles general body growth curve pattern whereas maxillary growth resembles neural growth curve pattern of ‘Scammon’s curve of systemic growth’.[41] Furthermore, as the adolescent growth spurt in males appear later than females the <SNB of males catch up with females in 13-16 age group with no statistically significant different findings.
The relative mandibular length, Go to Pog, B to Pog, Ar-Go (p<0.0001) and total gonial angle (p<0.001) are found to be decreased significantly than caucasians which can be explained considering stature of Caucasians. The <FMA angle found to be increased significantly in the present study (p<0.0001) than Tweed’s norms [29] Thus, concluded that coastal Odia population has steeper mandibular plane angle than Caucasians.[Figure 14]
Dentoalveolar mandible
The parameters L1 to NB, <L1 to MP and L1 to A-Pog describes about the inclination of mandibular incisors whereas the vertical positioning of mandibular teeth is explained by the parameters L1to MP and L6 to MP.
The parameters showing the dentoalveolar relationships of mandible had no significant intergender difference within the 9-12yr and 13-16yr age groups. In Odia population the dentoalveolar parameters of mandible i.e L1 to NB, <L1 to MP, L1 to A-Pog were significantly (p<0.0001) greater indicating more proclined lower incisors than Caucasians which is in agreement with earlier studies [7], [15], [39], [42], [43][Figure 15]. In the current study L1 to MP and L6 to MP measurements indicating the vertical height of mandibular incisors and molars, are significantly smaller(p<0.0001) than the Caucasians, this finding supported by the study of Trivedi et al.[37] in Rajasthan.
Maxillo mandibular relationship
Wits appraisal describes about the anteroposterior relation between maxilla and mandible. In the present study negative wits value in males and positive wits value in females of 9-12yr age significantly (p<0.05) shows that males have the mandible more posteriorly positioned than females which is in consonant with earlier observation of <SNB in this age group. In 13-16yr age group there is no significant difference between both the sexes. Similar conclusion established by earlier Indian studies.[39]
In the present study Jarabak ratio is found to be greater in females than males in 9-12yr age in significant manner (p<0.05) and smaller in females than the males in 13-16yr age in significant manner (p<0.05), which denotes that in 9-12yr of age females have more horizontal growth tendency carrying mandible more anteriorly than males but in the older age group i.e 13-16 years males show more horizontal growth than females thus catching up the anterior mandibular position. Similarly, Bjorks sum was greater in males than females of 9-12yr age group whereas it is reverse in 13-16yrs. Interincisal angle is significantly higher in females of 13-16yr age (p<0.05) than males indicating more upright incisors in females.
The maxillomandibular parameters such as <ANB, Angle of convexity, Jarabak ratio, <PP-MP when compared with Caucasians were found to be significantly greater (p<0.0001). On the contrary the ANS-Gn, Bjorks sum, Interincisal angle were found to be less than the Caucasians (p<0.0001) [Figure 16].
The <ANB readings can be misleading by vertical and A-P position of nasion which is a landmark of cranial base.[32] Thus, the reliability of ANB as a parameter to describe maxillomandibular relationship in sagittal plane is questionable. The present findings support Jacobson’s findings[1] that wit’s appraisal is more reliable parameter than <ANB for describing maxillomandibular relationship.
The mean angle of convexity in Coastal Odias is found to be greater (5.79±3.79) than Downs Caucasian norms (0±5.1). Similar observation was made by Gleis et al.[25] on Israelli population. Greater <PP-MP values than Caucasians indicates steeper mandibular plane pattern in coastal Odia children.
Soft tissue
The soft tissue contours designed to evaluate how the integuments overlay the dentofacial hard tissues of the face in a coastal Odia child.
In the present study, significant (p<0.05) intergender difference is noted in upper and lower lip prominence with males having greater lip prominence than females of 13-16yr age group. As noted earlier coastal Odia males of similar age group have more proclined maxillary anterior teeth than females which may explain this greater lip prominence in males. Nasofacial angle is found to be significantly (p<0.05) more in males of 9-12yr age than females. The nasolabial angle in this study has large standard deviation (111.5± 9.19) similar to findings observed in the study conducted on Caucasian American males.[44]
The nasolabial angle, upper lip protrusion and upper lip to E-line, lower lip prominence and lower lip to E-line in Odia population were significantly (p<0.0001) larger than Caucasians indicating more prominent upper lip and lower lip. Ricketts.[30] found upper lip to be ideally 4mm posterior to aesthetic plane for adult females while in males it is a bit more retracted and lower lip be ideally 2.0 mm posterior to this line in males. The mean value for E-line to upper lip in present study is (-1.017±2.303mm) and the mean value for E-line to lower lip is 1.125±2.264 which are more than normal value (–4mm ±2mm) indicating that the Coastal Odia children have more protrusive upper and lower lips. Finally, the upper lip thickness and upper lip strain are found to be significantly less than Caucasians [44] (p<0.0001).[Figure 17]
Conclusion
It would be preferable to use specific coastal Odia norms, separate for gender, because a comparison has revealed statistically significant differences in most variables between males and females and between coastal Odias and Caucasians.
Overall dimension of cranial base, maxilla and mandible are smaller in Coastal Odia children. Odia children have steeper mandibular plane angle, more proclined upper and lower incisors and smaller upper and lower dental height in anterior and posterior region. Coastal Odia children have greater upper and lower lip prominence but lesser upper lip thickness and strain than Caucasian population.
Coastal Odia males have greater anterior cranial base length, steeper mandibular plane, more posteriorly positioned mandible than females in 9-12 yr age group. In 13-16yr age group males have greater anterior vertical height of maxilla and less upright incisors than female. The Jarabak ratio is greater in females than males in 9-12-year age group.
Source of Funding
None.
Conflict of Interest
None.
References
- A Jacobson. Radiographic cephalometry. 1995. [Google Scholar]
- S Kapoor, D N Kapoor, J N Jaiswal. Cephalometric evaluation of skeleton-dental morphology in transitional dentition.. J Indian Soc Pedodont Prevent Dent 2000. [Google Scholar]
- H Schwartz. The norm concept -its use and abuse. The Angle orthodontist. 1953. [Google Scholar]
- V B Kotak. Cephalometric evaluation of Indian girls with neutral occlusion. J Indian Dent Assoc 1964. [Google Scholar]
- R Nanda, R S Nanda. Cephalometric study of the dentofacial complex of North Indians. Angle Orthodontist 1969. [Google Scholar]
- R Mohode, A Betigiri. An establishment of skeletal &soft tissue norms for Indian Marathi population and relating it with the perception of balanced profiles by lay person. Journal of Indian Orthodontic society 2008. [Google Scholar]
- M Bhat, P Sudha, S Tandon. Cephalometric norms for Bunt and Bramhin children of Dakhina Kannada based on Mc Namara’s analysis. J Indian Soc Pedodont and Prevent Dent 2001. [Google Scholar]
- O P Mehta, D S Gupta. A study of cephalometric appraisal of the inheritance of craniofacial pattern in Gorkhas. J Indian Soc Pedod Prev Dent 2008. [Google Scholar]
- J G Kannappan, M R Balasubramaniam. Cephalometric norms for Madras city population. J Indian Dent Assoc 1976. [Google Scholar]
- O P Kharbanda, S S Sidhu, K R Sundram. Cephalometric profile of Aryo-dravidians. J Indian Orthod Soc 1989. [Google Scholar]
- T Anuradha, JR Taneja, SL Chopra. Steiners norms for north Indian pre-school children. J Indian Soc Pedodont Prevent Dent 1990. [Google Scholar]
- K K Abraham, S Tandon, U Paul. Selected cephalometric norms in south kanara children. J Indian Soc Pedodont Prevent Dent Sept 2000. [Google Scholar]
- B Syamkumar, P Shree, V Revathi. Dentofacial Cephalo metric Norms for Hyderabad Population. J Orofac Sci 2009. [Google Scholar]
- H Grewal, SS Sidhu, OP Kharbanda. Cephalometric appraisal of the craniofacial pattern in Indo-aryans. J Indian orthod Soc 1995. [Google Scholar]
- E Argyropolous, U Sassouni. Comparison of the dentofacial patterns for native Greek and American Caucasian adolescents. Am J Orthod Dento Fac Orthoped 1989. [Google Scholar]
- R E Alcalde, T Jinno, M A Pogrel, T Matsumura. Cephalometric norms in Japanese adults. J Oral Maxillofac Surg 1998. [Google Scholar]
- T L Alexander, H P Hitchcock. Cephalometric standards for American Negro children. Am J Orthod Dent Fac Orthoped 1978. [Google Scholar]
- V Cerci, J E Martins, M A Oliveira. Cephalometric standards for white Brazilians. Int J Adult Orthod Orthog Surg 1993. [Google Scholar]
- M S Cooke, S H Wei. A comparative study of southern Chinese and British Caucasian cephalometric standards. The Angle Orthodontist 1989. [Google Scholar]
- HS Hwang, WS Kim, J A Mcnamara. Ethnic differences in the soft tissue profle of Korean and European-American adults with normal occlusions and well-balanced faces.. Angle Ortho Dontist 2002. [Google Scholar]
- B Obloj, P Fudalej, Z Dudkiewicz. Cephalometric standards for Polish 10-year-olds with normal occlusion. The Angle Orthodontist 2008. [Google Scholar]
- A Hassan. Cephalometric norms for Saudi adults living in the Western Region of Saudi Arabia. The Angle Orthod 2006. [Google Scholar]
- M A Moldez, K Sato, J Sugawara, H Mitani. Linear and angular filipino cephalometric norms according to age and sex. Angle Orthod 2006. [Google Scholar]
- F F Drevensekm, G Vidmar. Cephalometric standards for Slovenians in the mixed dentition period. Eur J Orthod 2006. [Google Scholar]
- R Gleis, N Brezniak, M Lieberman. Israeli cephalometric standards compared to Downs and steiner analysis.. Angle Orthod 1989. [Google Scholar]
- A J Shaikh, A R Alvi. Comparison of cephalometric norms of esthetically pleasing faces. American Journal of Orthodontics and dento facial orthopedics 2009. [Google Scholar]
- W B Downs. Variations in facial relationship. Their significance in treatment and prognosis. Am J Orthod Dento Fac Orthop 1948. [Google Scholar]
- W John, U Hagg, A B Rabie. Chinese norms of McNamara’s cephalometric analysis.. Angle Orthod 2007. [Google Scholar]
- C H Tweed. The Frankfort-mandibular-incisal angle (FMIA) in orthodontic diagnosis treatment planning and prognosis. Angle Orthod 1954. [Google Scholar]
- R A Ricketts. The influence of orthodontic treatment on facial growth and development.. Angle Orthod 1960. [Google Scholar]
- J A Mcnamara. A method of cephalometric evaluation. Am J Orthod Dento Fac 1984. [Google Scholar]
- A Bjork. The face in profile. Am J Orthod Dento Fac Orthp 1948. [Google Scholar]
- J R Jarabak, J A Fizzell. . Technique and Treatment with Lightwire Edgewise Appliance 1972. [Google Scholar]
- C J Burstone, R B James, H Legan, G A Murphy, L A Norton. Cephalometrics for Orthognathic Surgery. J Oral Surg 1979. [Google Scholar]
- N Talic, S Al-Barakati. Cephalometric measurments of a Pakistani adult sample according to Jarabak's analysis. J Pak Med Assoc 2009. [Google Scholar]
- W J Ursi, C A Trotman, J A Mcnamara, R G Behrents. Sexual dimorphism in normal craniofacial growth. . Angle Ortho Dont 1993. [Google Scholar]
- K Trivedi, S Singh, D M Shivamurthy, J Doshi, T Shyagali, B Patel. Analysis of cephalometrics for orthognathic surgery: determination of norms applicable to Rajasthani population. National journal of maxillofacial surgery 2010. [Google Scholar]
- C C Steiner. Cephalometric for you and me. Am J Orthod Dentofac Orthoped 1953. [Google Scholar]
- A Yadav, AN Datarkar, R Rajan, KH Chaoji. Cephalometric norms for Central Indian population using Burstone and Legan analysis. Indian J Dent Res 2011. [Google Scholar]
- H A Mohammad, M Hassan, S Hussain. Cephalometric evaluation for Malaysian Malay by Steiner analysis. Sci Res Essays 2011. [Google Scholar]
- R M Malina, C Bouchard. Bar-Or O. Growth, maturation, and physical activity. 2004. [Google Scholar]
- AM Hamdan, WP Rock. Cephalometric norms in an Arabic population. J Orthod 2001. [Google Scholar]
- G Janson, M De Freitas, A Pinzan, EJ Franco. Craniofacial characteristics of Caucasian and Afro-Caucasian Brazilian subjects with normal occlusion. J Appl Oral Sci 2011. [Google Scholar]
- H L Legan, C J Burstone. Soft tissue cephalometric analysis for orthognathic surgery. J Oral Surg 1980. [Google Scholar]