Introduction
General health of a child is directly influenced by his nutritional status. On one hand where being underweight predisposes a child towards infectious ailments1 whereas on the other hand obesity during childhood has been associated with many metabolic and cardiovascular illnesses. Childhood obesity has also shown a positive correlation with advanced pubertal development and often leads to precocious skeletal maturation of the upper and lower jaws.2 The maturational status of a person can have significant impact on orthodontic diagnosis, treatment planning, and therapeutic outcomes that are aimed to produce orthopedic effect in the craniofacial structures. Skeletal age assessment is a relied upon religiously during regular orthodontic practise.3 Dermatoglyphics, study of epidermal ridges and their configuration on hands, foot and toes, is a new and advancing branch of medical science and their use in diagnosis is now well established in many diseases.4 So the aim of the present study is to observe different types of dermatoglyphic patterns in adolescents of various body mass index percentile and their association, if any,with BMI and skeletal maturation, which will guide clinicians and scientists in deciding optimal treatment timings and effective therapies and in identifying higher risk individuals for early interventions.
Materials and Methods
The cross sectional study was conducted among subjects who reported to the Department of Orthodontics and Dentofacial Orthopedics, Institute of Dental Sciences, Bareilly. Subjects who were willing to give their consent, belonging to the age group of 12-16 years and able to cooperate for the study were included in the study. A written consent was taken from their guardians. Ethical approval for the present study was granted by the IEC of IDS (IEC/ 89/2020). Each subject’s height, weight, lateral cephalogram and finger print patterns of right hand were recorded. Subjects with significant history that would affect physical growth and development and subjects with history of trauma to digit(s) of right hand were excluded.
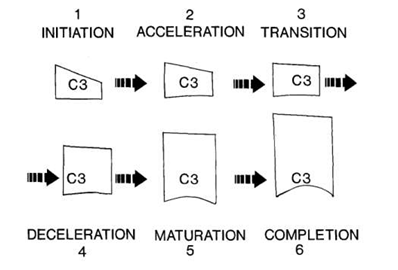

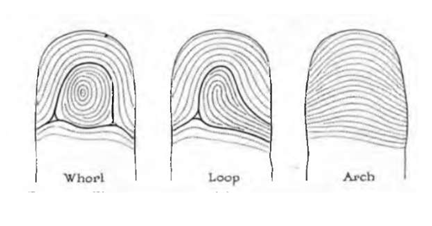
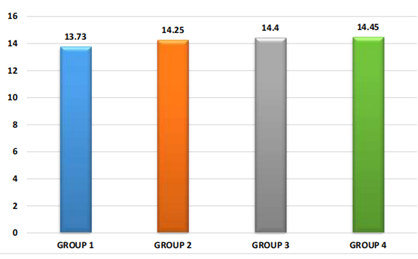
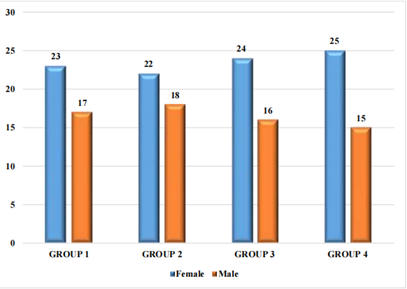
Table 1
Mean CVMI stages among all the four groups.
|
Variables |
Group |
Mean |
Std. Deviation |
F-Value |
P-Value |
|
|
1 |
3.53 |
0.96 |
17.11 |
<0.001* |
|
CVMI Stage |
2 |
4.00 |
0.91 |
|
|
|
|
3 |
4.78 |
0.80 |
|
|
|
|
4 |
4.78 |
1.15 |
|
|
|
|
|
4.83 |
|
|
|
Table 2
Frequency distribution and Intergroup comparison of types of fingerprint pattern observed in thumb of right hand among all the four groups.
|
|
|
Thumb |
Total |
P-Value |
|
|
|
AN(%) |
LN(%) |
WN(%) |
40(100) |
0.228# |
|
1 |
14(35) |
21(52.5) |
5(12.5) |
40(100) |
|
|
2 |
12(30) |
19(47.5) |
9(22.5) |
40(100) |
|
|
3 |
10(25) |
19(47.5) |
11(27.5) |
40(100) |
|
|
4 |
5(12.5) |
26(65) |
9(22.5) |
|
|
Table 3
Frequency distribution and Intergroup comparison of types of fingerprint pattern observed in Index finger of right hand among all the four groups.
|
Group |
Index Finger |
Total |
P- Value |
||
|
|
AN(%) |
LN(%) |
WN(%) |
|
|
|
1 |
|
25(62.5) |
9(22.5) |
40(100) |
0.047* |
|
2 |
|
17(42.5) |
13(32.5) |
40(100) |
|
|
3 |
|
28(70) |
10(25) |
40(100) |
|
|
4 |
5(12.5) |
18(45) |
17(42.5) |
40(100) |
|
Table 4
Frequency distribution and Intergroup comparison of types of fingerprint pattern observed in Middle finger of right hand among all the four groups.
|
Group |
Middle Finger |
Total |
P- Value |
||
|
|
AN(%) |
LN(%) |
WN(%) |
40(100) |
0.039* |
|
1 |
3(7.5) |
35(87.5) |
2(5) |
40(100) |
|
|
2 |
4(10) |
33(82.5) |
3(7.5) |
40(100) |
|
|
3 |
2(5) |
27(67.5) |
11(27.5) |
40(100) |
|
|
4 |
1(2.5) |
29(72.5) |
10(25) |
|
|
Table 5
Frequency distribution and Intergroup comparison of types of fingerprint pattern observed in Ring finger of right hand among all the four groups.
|
Group |
Ring Finger |
Total |
P-Value |
||
|
|
AN(%) |
LN(%) |
WN(%) |
|
|
|
1 |
2(5) |
23(57.5) |
15(37.5) |
40(100) |
0.347# |
|
2 |
3(7.5) |
20(50) |
17(42.5) |
40(100) |
|
|
3 |
0(0) |
20(50) |
20(50) |
40(100) |
|
|
4 |
0(0) |
20(50) |
20(50) |
40(100) |
|
Table 6
Frequency distribution and Intergroup comparison of types of fingerprint pattern observed in little finger of right hand among all the four groups.
|
Group |
Little Finger |
Total |
P-Value |
||
|
|
AN(%) |
LN(%) |
WN(%) |
40(100) |
0.720# |
|
1 |
1(2.5) |
35(87.5) |
4(10) |
40(100) |
|
|
2 |
2(5) |
35(87.5) |
3(7.5) |
40(100) |
|
|
3 |
1(2.5) |
34(85) |
5(12.5) |
40(100) |
|
|
4 |
0(0) |
38(95) |
2(5) |
40(100) |
|
Table 7
Correlation between types of fingerprint pattern observed in various BMI groups.
The Body Mass Index (BMI) percentile of the subjects fulfilling the inclusion criteria was calculated and they were subdivided into four groups (40 subjects in each group) depending on their BMI percentile.5, 6
Group 1: Underweight (<5th percentile)
Group 2: Normal weight (5th-85th percentile)
Group 3: Over weight (85th-95th percentile)
Group 4: Obese ( >95th percentile)
Method of analysis
All the subjects were evaluated for their respective stages of skeletal maturation and the type of dermatoglyphic patterns. The parts of cervical vertebrae (C2, C3, C4) as seen on lateral cephalogram were assessed. To compute the maturational stages of cervical vertebrae, visual assessment was done and stage of maturation was determined by Cervical Vertebral Maturational Index (CVMI) as described by Hassel & Farman3 in 1995. Six categories of cervical vertebrae skeletal maturation were defined and nomenclature was done. (Figure 1) The finger print patterns were recorded digitally using Mantra MFS100 biometric fingerprint scanner (Figure 2) and were categorized into arches, loops and whorls as per Galton’s classification.(Figure 3).
Results
The basic characteristics viz. age and sex distribution of four groups (Group 1, Group 2, Group 3, and Group 4) have been depicted in Graph 1 and 2 respectively. On comparing the age of subjects and sex proportions among Group 1 to Group 4, ANOVA revealed similar age and sex proportions.
On comparing mean CVMI among all the four groups there was a significant difference in the mean cervical vertebral maturational index of with a gradual increase from Group 1 to Group 4 as shown in Table 1.
The frequency distribution and inter group comparison of CVMI stages among all the four groups is represented in Graph 3 and found statistically significant. The most common CVMI stage in Group 1 and 2 was stage 4, in group 3 was stage 5 and in group 4 was stage 6 Figure 5 which suggested an advanced stage of skeletal maturation in obese individuals when compared with their underweight counterparts.
On comparing the finger print patterns of right hand among the subjects belonging to various BMI groups, loops were the most common type of fingerprint pattern followed by whorls and least common were arches. The frequency distribution and inter group comparison yield significant differences in fingerprint patterns of Index and Middle fingers of right hand among the BMI groups. (Table 2, Table 6)
A significant correlation was found among subjects of various BMIs and their finger print pattern. The maximum number of loops (69.5%) were found in subjects of Group 1 and minimum number of loops (62%) were seen in subjects of Group 2. The arch type of pattern was most frequently seen in Group 2 (15.5%) while it was least common in Group 4 (5.5%). The whorl type of pattern was most common in Group 4 (29%) and Group 3 (28.5%) and it was least commonly seen among individuals of Group 1 (17.5%). So there was a statistically significant difference in types of right finger print patterns observed in adolescents of various BMIs as shown in Table 7.
Discussion
Obesity and underweight are two growing paradox problems in today’s world. On a molecular level, an increased BMI has been associated with an increased production of destructive inflammatory cytokines which promote periodontal tissue destruction and alveolar bone loss.7 Furthermore, an increased BMI has been related with accelerated skeletal maturation,8, 9 dental development8, 9, 10, 11 and tooth eruption7 in growing patients as well as with an altered craniofacial morphology, such as increased mandibular length & bimaxillary prognathism12, 13 Based on these findings, it has been indicated that a higher BMI in children and adolescents is a risk factor for more treatment problems during orthodontic treatment, and that this may necessitate changes in treatment planning, such as earlier initiation of orthodontic treatment, more regular reinforcement of oral hygiene, use of fluoride mouth rinse and closer monitoring of compliance during orthodontic treatment.7
This study was conducted on 160 adolescent subjects of age group of 12-16 years as the majority of orthodontic treatment is directed towards pre-adolescent and adolescent patients because they are undergoing complex changes in their occlusions, facial skeleton and profiles.14
The gradual increase in CVMI staging from Group 1 to 4 is in accordance with the study done by Sadeghianrizi et al,13 Hilgers et al,10 who also have concluded that obese adolescents had earlier craniofacial growth and development than their normal peers. At the same time Erwansyah E et al15 and Nicolas et al.15 in their study have found a linear correlation between increased BMI and accelarated dental age and decreased BMI indicated delayed dental age of subjects aged 8-15 years. However there was no statistically significant differences as for skeletal-dental maturation was seen among obese in study conducted by Akridge et al.16
French et al.17 evaluated effects of elevated BMI on skeletal age and concluded that overweight children have an advanced skeletal age of 13 months. Similar results have been found in various studies done by Costacurta M18 et al., Guica MR et al.19 Mack KB et al.8 Bodapati S et al.20 who also showed advanced skeletal matu19 ration in obese individuals. Jaruratanasirikul et al.21 in their study showed that obese girls grow faster and had earlier menarche and stop growing faster. Kumar et al.6 found that delayed dental and bone age is a significant feature in underweight children. Since the above mentioned studies and the present study has highlighted the influence of BMI on the growth and development of the subjects, so height, weight and BMI scores of every individual in growing phase who seeks orthodontic or orthopedic treatment should be taken into consideration while formulating the customized treatment plan for the particular subject.
On studying the fingerprint pattern in right index finger (Table 3), loops were most common in subjects of Group 3 (70%) followed by whorls in Group 4 (42.5%) and arches in Group 2 (25%) which is in accordance to the study done by Alberti et al.22 A similar observation is also seen in study done by Smail S et al.22 who found maximum Table 3 number of loops in right index finger but maximum loops were found in normal individuals which was in contrast to the findings of the present study. The findings of another study done by Bhardwaj N et al.4 who found maximum number of loops in normal individuals which was contrary to the findings of present study.
On observing the fingerprint pattern in right middle finger (Table 4), loops were most common in Group 1 (87.5%). Arches were most common in Group 2 (10%) and whorls were most common in Group 3 (27.5%) and this observation was also statistically significant. This was in contrast to the findings in study by Alberti et al, 23 Smail S et al. and Bhardwaj et al.4 who found more number of loops in obese individuals and higher number of whorls in normal individuals.
On studying the frequency distribution of arches, loops and whorls in total study population, loops were the most commonly found pattern (65.3%) followed by whorls (24.4%) and arches (10.4%) which was similar to the result found in a study done by Smail S et al.22 On studying the distribution of fingerprint pattern in Group 1, Group 2, Group 3 and Group 4 (Table 7), loops were common in Group 1 (69.5%) which was contrary to the finding of Smail S et al. who found maximum number of loops in normal subjects. Whorls were common in Group 4 (29%) and least common in Group 1 (17.5%); and arches were mostly seen in Group 2 (15.5%) and minimum number of arches were seen in Group 4 (5.5%) and the results were found to be statistically significant. Smail S et al.22 found whorls were common in obese individuals, and arches have equal distribution between obese and normal individuals which was similar to the findings of the present study.
Conclusion
The result of the present study showed a significant advancement in skeletal maturity from Group 1 to Group 4 suggesting the influence of increased BMI on the skeletal maturation of the patient. The mean CVMI stage also increased significantly from Group 1 to Group 4 suggesting advance stage of skeletal maturation among obese individuals as compared to underweight individuals.
Also, a significant difference in fingerprint pattern of index and middle finger of right hand has been found among the adolescents of various BMIs. Loops were most common in right index finger in subjects of Group 3, whorls were mostly seen in subjects of Group 4 and arches in subjects of Group 2, suggesting whorls being mostly found in right index finger of obese individuals, arches in normal weight individuals and loops in overweight individuals. Loops were most common in right middle finger in subjects of Group 1, whorls in subjects of Group 3 and arches in Group 2, suggesting arches being mostly found in right middle finger in normal weight individuals, whorls in overweight individuals and loops in underweight Individuals.
Loops were most frequently found in subjects of Group 1, arches in subjects of Group 2 and whorls in subjects of Group 4. Significant differences were seen when fingerprint patterns were correlated with the subjects of various BMI groups. Loops were most common in underweight subjects, arches in normal individuals and whorls in overweight subjects.