- Visibility 99 Views
- Downloads 31 Downloads
- DOI 10.18231/j.jco.2024.003
-
CrossMark

To estimate the maturation of permanent teeth in different facial patterns in Rajasthan population: A comparative retrospective study
- Author Details:
-
 Archana Nagora
-
Piyush Bolya *
-
Nitin Dungarwal
-
Rutvik Trivedi
-
Animesh Mutha
Introduction
The aim of an ideal age estimation technique is to achieve an age as closest as possible to the chronological age. Different age estimation methods are present which are tested and reported in the literature. Skeletal maturity, height, menarche, etc., has been used to assess the age when unknown in children and adolescents. Dental age estimation has been more predictable compared to skeletal and other sexual maturity indicators because it is less variable.[1]
In dentistry, the most important role of studying a developmental status of an individual is the diagnosis and planning of treatment for orthopaedic jaw problems. The type and timing of orthodontic treatment and the prediction of its results are based on the prediction time, rate and direction of growth spurts.
All growth‐modification treatments such as use of functional devices such as chin cups and head gears, use of extraoral devices, regaining of space in the arches, and decision making on tooth extraction are possible only after the condition of an individual's development is obtained. So far, different methods such as the height or weight growth, appearance of secondary sex characteristics, the study of rate of growth, radiographic examination of the skeletal system, and examination of the condition of teeth have been proposed to determine the stage of development (Stewart et al., 1982). [2]
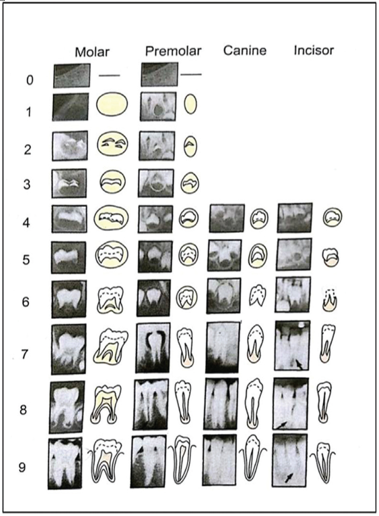
Different methods are available for estimating the dental age as advanced by Nolla’s (1960), [3] Haavikko’s (1970), [4] Demirjian’s (1973), [5] and modified Demirjian method by Guy Willems (2001). [6] The commonly used method for assessing dental age is Demirjian’s method because of its simplicity and more accuracy. This method has been widely used for the dental age estimation for years, but many authors [1], [7], [8], [9], [10] reported that Demirjian’s method overestimate the dental age. New method of dental age estimation was established by Willems in 2001 named Modified Demirjian method. Maber et al. [7] and Rai et al.8 in their study also concluded that Willems [6] method was more accurate method.
Dental age estimation is one among the various important factors in identifying a person’s age. Teeth and dental restorations are considered to be the means of identification in future perspective. Age estimation is one of the most important tool employed in establishing the identity of an individual, and it is performed for various reasons such as mass disasters such as fire accidents and crashes.
In human, determining the age is vital in individuals without birth certificate, who are getting married, attending school, joining the army, and also in the determination of criminal liability such as in incidents such as rape, kidnapping, illegal immigration, premature births, orthodontic malocclusion, and paediatric endocrinopathy. Teeth are most commonly used and most reliable indicator in age determination among the various parts of the body as tooth is more resistant to taphonomic process after death. [9]
The two major approaches to dental age estimation are age of tooth eruption and pattern of tooth development. Age of tooth eruption was widely accepted earlier, but now considered imprecise, because eruption is an ongoing process that includes periods in the life of a child when no tooth erupts into the oral cavity. Local factors also affect age of tooth eruption, such as premature extraction of primary teeth or crowding of permanent teeth. Alternatively, the development of teeth using radiographs can be assessed over long periods of time, in a continuous pattern, using different stages of tooth formation as criteria. [1]
According to Kraigman classification, dental age (DA) is covered under the biological age. However, there are two methods for its evaluation:
Observation of teeth clinically is the simplest and the accurate method;
Radiographic examination of teeth and tooth buds (Graber, 2000;[11]; Stewart et al., 1982.)[12]
The findings of both methods are compared with the standard tables for that particular population, and an estimate of the individual's developmental age is obtained. Various studies shows that dental age (DA) closely correlates with chronological age (Stewart et al., 1982; [12] CA; Jaeger 1990; [13] Koch & Poulsen, 2001.) [14] However, the use of dental indices is useful from birth to early adolescence (Bishara, 2001). [15] Dental development indices based on the calcification of the crown and root of teeth are preferred to maturity parameters based on growth rate because these indices are useful not only during the limited period of tooth emergence but also throughout the development and growth of teeth. Clinical observations and use of maturity parameters are further compromised by the main causes of teething not being completely known (Demirjian, Goldstein, & Tanner, 1973). The Demirjian's method utilizes radiographic examination to overcome these challenges. [2]
Among various methods, the Demirjian system of age assessment has been widely accepted. The advantages of the Demirjian method include the objective criteria describing stages of tooth development, which have been illustrated with line diagrams and radiographic images in a clear-cut manner. Various studies have been done in recent years using the Demirjian method in different populations. [1] A considerable number of studies, however, have reported overestimation and inaccuracy of its use in their respective populations.
Willems et al. [6] modified the Demirjian technique by creating new tables, from which a maturity score could be directly expressed in years. The cumbersome step of conversion of maturity score to dental age was deleted, making it simpler, yet retaining the advantages of the Demirjian technique. They also found that this method reduced the overestimation of dental age, which was not statistically different from zero in a Belgian population. [6] This method was also adapted by Maber et al. [7], who found the estimated dental age to be more accurate than the Demirjian method.
Nanda [16] observed a difference in timing of the adolescent growth spurt between subjects with different vertical facial types. Those with a skeletal open bite began the adolescent growth spurt in the facial structures earlier than those with a skeletal deep bite. Nanda [16] and Rowe [17] found that timing of the adolescent growth spurt for various facial dimensions in open-bite faces was earlier than in deep bite faces. According to these authors, considering the proportionality of growth, the underlying factors responsible for observed differences in the year of maximum growth appear to be related to intrinsic characteristics of each facial form.
The patterns of dimensional increase in each facial type affect their maturational level, producing different adolescent growth spurt timings. A difference in dental maturation in subjects with different facial types was observed in a study in which subjects with a skeletal open bite had a slight tendency toward advanced dental maturation compared with those with a skeletal deep bite. [18]
However, Jamroz et al. [19] investigated the relationship between vertical growth patterns and dental maturation in children with long and short anterior facial height and concluded that there was no difference in dental age between long and short facial types. Therefore, it is evident from the above studies that vertical growers mature earlier than horizontal growers whereas according to Jamroz there existed no difference between two types of facial growers.
Janson et al. [20] was probably first to investigate the influence of facial types on dental development in subjects of the same chronological age. They showed that hyperdivergent subjects presented a tendency to have an advanced dental maturation in comparison to hypodivergent subjects. Naves et al. [18] compared the maturation stages of permanent teeth in subjects with vertical and horizontal growth patterns and concluded that subjects with vertical growth patterns had earlier dental maturation than horizontal growers.
The aim of this study is to estimate and compare the maturation stages of permanent teeth in subjects with different facial patterns in Rajasthan population.
To find out if there are any sex related difference in dental age maturation among different growth patterns.
Aim
To estimate and compare the maturation stages of permanent teeth of age group (8-16 years) in different facial patterns in Rajasthan population.
Objectives
To compare and correlate between the chronological age and the dental age of patients with horizontal, vertical and average growth patterns.
Materials and Methods
Materials:([Figure 1])
Pre-treatment Lateral Cephalograms
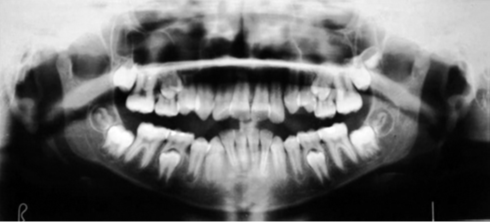
Pre-treatment Orthopantomograms
Tracing Paper (lead acetate sheet 0.3 mm thickness)
Measuring stationary
Source of data
The study comprised of 90 patients. Data were collected from Department of Orthodontics and Dentofacial Orthopedics, Darshan Dental College and Hospital, Loyara Udaipur (Rajasthan).
Study Design
Collection of data
Lateral Cephalograms and Orthopantomograms were collected for this study and categorized into different facial patterns on the basis of Sn-Go-Gn, Lower anterior facial height and Jarabak’s ratio and were divided in groups ([Table 1], [Table 2] ).
The sample were further divided into male and female subgroups.
Inclusion criteria
Subjects of age 8 years to 16 years.
Subjects with normally erupting permanent teeth.
Availability of complete patient record.
Exclusion criteria
Χ Subjects having any supernumery teeth.
Χ Subjects having congenital missing teeth.
Χ History of bilateral extractions.
Χ History of trauma.
Method of Study
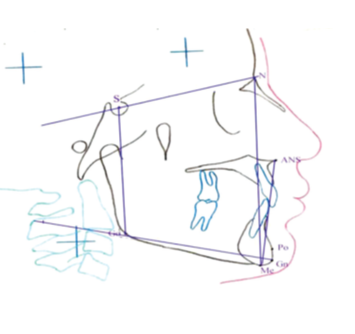
Name, age, sex, date of birth of each subject were noted for categorizing and to estimate the chronological age of the individual. The lateral head cephalogram and orthopantomograms of the subjects were taken. The cephalometric tracing were carried out by using transilluminated view box on one side glazed acetate paper of 0.3 mm thickness using 0.5 mm lead pencil. Set squares, half millimeter scale and protractor that could measure up to 0.5° were used to measure the angular measurements. Cephalometric landmarks and planes used in the study are given in [Figure 2].
Classification of subjects according to growth patterns
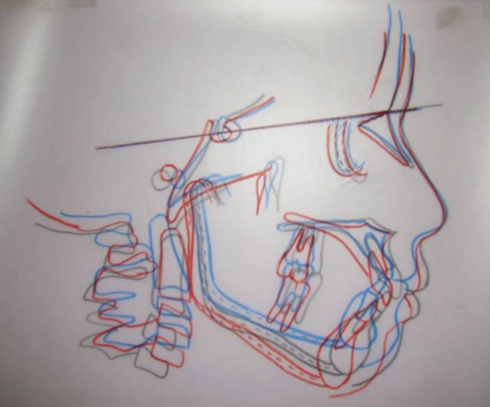
For cephalometric measurements following parameters were used for classification of growth patterns ([Table 1] and [Table 2]). Landmarks and planes used in cephalometric evaluation to classify sample in different growth pattern as shown in [Figure 2]. Superimposition tracing of horizontal, vertical and average groups is shown in [Figure 3]. Based on the above parameters all the subjects were categorized in three groups for boys and girls separately.
|
Parameters |
Horizontal growth patterns |
Vertical growth patterns |
Average growth patterns |
|
SN-Go-Gn (Steiner’s) |
<30° |
>34° |
32 +- 2° |
|
Lower anterior facial height |
<62 mm |
>62 mm |
60–62 mm |
|
Jarabak ratio (Jarabak) |
>65% |
<62% |
62%–65% |
|
Sr. No. |
Group |
Growth patterns |
Sample size |
|
|
1. |
Group 1 |
Horizontal growth patterns |
30 |
Male 15 |
|
Female 15 |
||||
|
2. |
Group 2 |
Vertical growth patterns |
30 |
Male 15 |
|
Female 15 |
||||
|
3. |
Group 3 |
Average growth patterns |
30 |
Male 15 |
|
Female 15 |
|
Stage |
31 |
32 |
33 |
34 |
35 |
36 |
37 |
38 |
|
0 |
|
|
|
|
|
|
|
6.40 |
|
1 |
|
|
|
|
|
|
2.09 |
7.74 |
|
2 |
|
|
|
|
2.43 |
|
2.57 |
8.92 |
|
3 |
|
|
|
2.56 |
3.43 |
|
2.65 |
9.31 |
|
4 |
|
|
2.55 |
3.54 |
3.83 |
|
4.1 |
10.22 |
|
5 |
2.58 |
2.65 |
3.15 |
5.09 |
5.75 |
2.58 |
6.51 |
11.04 |
|
6 |
3.1 |
4.54 |
5.4 |
6.31 |
6.81 |
3.25 |
8 |
12.65 |
|
7 |
5.02 |
5.40 |
7.19 |
8.09 |
8.7 |
4.25 |
9.13 |
13.77 |
|
8 |
6.66 |
7.02 |
9.22 |
9.82 |
10.8 |
6.88 |
11 |
14.45 |
|
9 |
10.61 |
10.89 |
11.99 |
12.29 |
12.79 |
10.94 |
13.84 |
16.65 |
|
Stage |
31 |
32 |
33 |
34 |
35 |
36 |
37 |
38 |
|
0 |
|
|
|
|
|
|
1.7 |
6.19 |
|
1 |
|
|
|
|
1.69 |
|
2.98 |
7.64 |
|
2 |
|
|
|
1.70 |
2.27 |
|
3.41 |
8.28 |
|
3 |
|
|
1.70 |
1.98 |
3.41 |
|
4.74 |
8.86 |
|
4 |
|
|
2.67 |
3.52 |
3.41 |
|
4.88 |
9.89 |
|
5 |
2.31 |
2.55 |
4.34 |
5.19 |
5.59 |
2.13 |
6.69 |
11.17 |
|
6 |
4.35 |
4.71 |
6.14 |
6.47 |
6.96 |
3.73 |
7.89 |
12.25 |
|
7 |
5.16 |
5.75 |
7.59 |
8.18 |
8.68 |
4.94 |
9.08 |
13.66 |
|
8 |
6.56 |
6.97 |
9.52 |
9.84 |
10.64 |
7 |
11.13 |
14.07 |
|
9 |
10.68 |
10.91 |
12.57 |
12.57 |
13.11 |
11.22 |
13.63 |
15.32 |

|
Groups |
N |
Chronological Age (in years) |
Dental Age (in years) |
Diff. of mean (in years) |
P value |
||
|
|
|
Mean |
SD |
Mean |
SD |
|
|
|
Horizontal growth patterns |
15 |
10.40 |
1.58 |
10.06 |
1.71 |
0.34 |
0.06 |
|
Vertical growth patterns |
15 |
9.78 |
1.24 |
9.57 |
1.80 |
0.21 |
0.06 |
|
Average growth patterns |
15 |
10.32 |
1.03 |
9.90 |
1.39 |
0.42 |
0.22 |
|
Groups |
N |
Chronological Age (in years) |
Dental Age (in years) |
Diff. of mean (in years) |
P value |
||
|
|
|
Mean |
SD |
Mean |
SD |
|
|
|
Horizontal growth patterns |
15 |
11.17 |
1.26 |
10.66 |
1.17 |
0.51 |
0.05 |
|
Vertical growth patterns |
15 |
9.34 |
1.07 |
10.11 |
1.44 |
0.77 |
0.00* |
|
Average growth patterns |
15 |
11.05 |
1.30 |
10.59 |
1.07 |
0.46 |
0.09 |
|
Groups |
N |
Mean dental age (in years) |
Diff. of mean (in years) |
P value |
|
|
Horizontal vs Vertical growth patterns |
15 |
Horizontal growth patterns |
Vertical growth patterns |
0.49 |
0.20 |
|
10.06 |
9.57 |
||||
|
Vertical vs Average growth patterns |
15 |
Vertical growth patterns |
Average growth patterns |
0.33 |
0.91 |
|
9.57 |
9.90 |
||||
|
Horizontal vs Average growth patterns |
15 |
Horizontal growth patterns |
Average growth patterns |
0.16 |
0.29 |
|
10.06 |
9.90 |
|
Groups |
N |
Mean dental age (in years) |
Diff. of mean (in years) |
P value |
|
|
Horizontal vs Vertical growth patterns |
15 |
Horizontal growth patterns |
Vertical growth patterns |
0.55 |
0.37 |
|
10.66 |
10.11 |
||||
|
Vertical vs Average growth patterns |
15 |
Vertical growth patterns |
Average growth patterns |
0.48 |
0.13 |
|
10.11 |
10.59 |
||||
|
Horizontal vs Average growth patterns |
15 |
Horizontal growth patterns |
Average growth patterns |
0.07 |
0.61 |
|
10.66 |
10.59 |
|
|
Sum of Squares |
Mean Square |
Sig. |
|
|
Sn-Go-Gn |
Between Groups |
1545.267 |
772.633 |
.000** |
|
Within Groups |
690.733 |
7.939 |
|
|
|
LAFH |
Between Groups |
402.689 |
201.344 |
.000** |
|
Within Groups |
1937.133 |
22.266 |
|
|
|
JR |
Between Groups |
961.877 |
480.938 |
.000** |
|
Within Groups |
510.334 |
5.866 |
|
|
|
Male |
Female |
||
|
r |
p value |
r |
p value |
|
|
Horizontal growth patterns |
0.789+++ |
0.001* |
0.874+++ |
0.000** |
|
Vertical growth patterns |
0.819+++ |
0.000** |
0.839+++ |
0.000** |
|
Average growth patterns |
0.850+++ |
0.000** |
0.805+++ |
0.000** |
|
Combined |
0.818+++ |
0.000** |
0.838+++ |
0.000** |
Results
A total of 90 patients with age group 8-16 years were included in the study. Based on growth patterns, total sample was divided into horizontal, vertical and average growth patterns. Out of selected 90 subjects, 45 were males and 45 were females and among 45 males, 15 males in each group were horizontal growers, vertical growers and average growers. Likewise among 45 females, 15 females in each group were horizontal growers, vertical growers and average growers.
Regression equation
Acharya [21] has given the regression equation for both boys and girls where X is the sum of eight left mandibular teeth. In case of unilateral extraction and radiographic errors, same tooth from the opposite side was taken into consideration.
Regression formulae given by Acharya for both boys and girls is
BOYS = 0.1303 X + 1.9345
GIRLS = 0.1509 X – 0.2704
Where X is the sum of left eight mandibular teeth.


[Table 5] shows that in males, there is insignificant difference between chronological age and dental age with mean difference of 0.34 year, 0.21 year and 0.42 year for horizontal ([Figure 6]), vertical ([Figure 7]) and average growers ([Figure 8]) with p value of 0.06, 0.06 and 0.22 respectively.
[Table 6] shows that in females, there is significant difference between chronological age and dental age with mean difference of 0.77 year for vertical growers ([Figure 7] ) with p value of 0.00 and there is insignificant difference between chronological age and dental age in females with mean difference of 0.51 years and 0.46 years for horizontal growers ([Figure 6]) and average growers ([Figure 8]) with p value of 0.05 and 0.09 respectively.
[Table 7] shows insignificant intergroup difference in males between dental age group in horizontal vs vertical, vertical vs average and horizontal vs average growers with mean difference of 0.49 year, 0.33 year and 0.16 year with p value of 0.20, 0.91 and 0.29 respectively.
[Table 8] shows insignificant intergroup difference in female between dental age group in horizontal vs vertical, vertical vs average and horizontal vs average growers with mean difference of 0.55 year, 0.48 year and 0.07 year with p value of 0.37, 0.13 and 0.61 respectively.
[Table 9] shows ANOVA test for comparision between groups and within groups that is horizontal, vertical and average growth patterns suggesting Sn-Go-Gn, LAFH and Jaraback’s ratio to be highly significant in determining horizontal, vertical and average growth patterns.
[Table 10] shows Pearson’s correlation coefficient “r” was calculated between dental age and chronological age in males ([Figure 9]) and [Figure 10] females subgroups. It is observed that significant correlation exists in both males and females in different growth patterns that is horizontal, vertical and average growth patterns and this correlation also exists between combined sample with r value in males is 0.789, 0.819, 0.850 and 0.818 and p value in males is 0.001, 0.000, 0.000 and 0.000 respectively. Significant correlation also exists in females in different growth patterns that is horizontal, vertical and average growth patterns and also between combined sample with r value of 0.874, 0.839, 0.805 and 0.838 and p value of 0.000, 0.000, 0.000 and 0.000 respectively.
Discussion
Various methods are available to estimate the dental age as advanced by Nolla’s (1960), [3] Haavikko’s (1970)[4], Demirjian’s (1973) [5] and Modified Demirjian method by Guy Willems (2001). [6] Commonly used method for dental age estimation is Demirjian’s method because of its simplicity and more accuracy but many authors [1], [2], [10], [12], [13], [14] reported the overestimation of dental age by Demirjian’s method ranging from 0·02 to 3·04 years. [22] Koshy and Tandon [23] recorded a greater overestimation that is (2·82 years for females and 3·04 for males) when studying the Indian population. Willems [6] in 2001 established the new method that is Modified Demirjian’s method for dental age estimation.
Neves et.al (2005) [18] compared the maturation of permanent teeth in subjects with vertical and horizontal growth patterns and concluded that subjects with vertical growth patterns mature earlier dentally than subjects with horizontal growth patterns. Janson et.al in (1998) [20] investigated the difference in dental maturation between skeletal open bite and deep bite in subjects of same chronological age and concluded that skeletal open bite subjects have advanced dental maturation compared to skeletal deep bite subjects.
Nanda in (1988) [16] examined the patterns of facial growth development in subjects with skeletal open-bite and skeletal deep-bite faces and concluded that open bite subjects have advanced adolescent growth compared to deep bite subjects. Jamroz et.al in (2006) [19] investigated the dental maturation in short and long facial types and concluded that difference in dental age in short and long facial types is not big enough to be clinically relevant.
According to Nanda, [16] Neves [18] and Janson [20] vertical grower individual showed early dental age maturation compared to horizontal grower individual but according to Jamroz [19] there is no difference in dental maturation between horizontal and vertical grower individual so there is different opinion by different authors. The aim of this study was to determine the maturation of dental age in horizontal, vertical and average growth patterns. The method used in this study was Modified Demirjian’s method by a guy Willems. Studies done by Maber in (2006), [7] Rai in (2006) [8] and Marta in (2020) [24] suggested the accuracy of Modified Demirjian’s method compared to other method.
The present study was done to estimate the maturation of permanent teeth in subjects with horizontal, vertical and average growth patterns using Student t test in males and females. Regression equation was generated as stated by Acharya [21] shows the higher significance of regression equation for both boys and girls. Difference between chronological age and dental age was found to be clinically significant in vertical female with mean difference of 0.77 year and p value of 0.00 compared to vertical male with mean difference of 0.21 year and p value of 0.06 respectively. Insignificant in average male, average female with mean difference of 0.42 year and 0.46 year and p value of 0.22 and 0.09 and also insignificant in horizontal male and horizontal female with mean difference of 0.34 year and 0.51 year and p value of 0.06 and 0.05 respectively. Chronological age is ahead of dental age in horizontal and average growth patterns and dental age is ahead of chronological age in vertical growth patterns. This suggest that there is earlier maturation of dental age compared to chronological age in vertical female growth patterns compared to horizontal and average growth patterns.
Results of the present study are similar to that reported by Nanda (1988) [16] examined the patterns of facial growth development in subjects with skeletal open-bite and skeletal deep-bite faces supporting vertical growth patterns shows early dental maturation compared to horizontal and average growth patterns, Neves et.al (2005) [18] compared the maturation of permanent teeth in subjects with vertical and horizontal growth patterns, Janson et.al in (1998) [20] investigated the difference in dental maturation between skeletal open bite and deep bite in subjects of same chronological age, Rowe (1988) [17] examined open bite individuals matured earlier than deep bite individuals and Vikas Goyal (2011) [25] concluded that subjects with vertical growth patterns matured early than horizontal growth patterns in the same chronological age.
Jamroz et.al (2006) [19] investigated the dental maturation in short and long facial types is not large to be clinically significant which does not support present study. The present study suggests that vertical female growth patterns individual mature earlier compared to horizontal and average growth patterns.
Difference in dental age and chronological age between male and female subgroups shows early maturation in females compared to males in vertical growth patterns. Intergroup difference in dental age when comparing between horizontal vs vertical, average vs vertical and average vs horizontal growth patterns exist but is not clinically relevant.
In the present study when overall comparision of Sn-Go-Gn, LAFH and Jaraback’s ratio were done between and within horizontal, vertical and average growth patterns it is found to be significant for assessing the horizontal, vertical and average growth patterns.
Sierra in (1987) [26] found a high correlation (r - 0.7 to r - 0.8) between dental calcification and skeletal age by using an eight-ossification centered method. Hagg and Taranger (1982) [27] found a low correlation (r - 0.35) between pubertal growth and dental eruption whereas Vallejo-Bolanos and Espana-Lopez (1997) [28] found a marked positive relationship between dental development and body growth. In addition, Chertkow (1980) [29] observed a high correlation (r - 0.88) between pubertal age and the calcification stages of the lower canine, Vivek Rai in (2014) [30] observed strong correlations between dental and skeletal maturation and suggested that radiographic determination of dental age (DA) could be a useful tool for providing an additional source of information in the treatment planning of children.
Pearson’s correlation coefficient was also calculated in the present study between dental age and chronological age in horizontal, vertical and average growth patterns in male and female subgroup. It is observed that there exists significant correlation between males and female subgroup in different growth patterns that is horizontal, vertical and average growth patterns with p value of 0.000 and this correlation also exists between combined sample with p value of 0.000 respectively.
Conclusion
From the above analysis by modified Demirjian’s method given by a guy Willem’s following conclusion can be drawn that:-
Vertical female growth patterns has early dental age maturation compared to chronological age.
Horizontal and average growth patterns individual does not effects dental age in both sex.
Intergroup comparision between horizontal vs vertical, vertical vs average and horizontal vs average growth patterns does not effects dental age.
Horizontal, vertical and average growth patterns individuals are highly significantly correlated to dental age and chronological age in males and female subgroup.
Source of Funding
None.
Conflict of Interest
None.
References
- SA Mani, LI Naing, J John, AR Samsudin. Comparison of two methods of dental age estimation in 7-15-year-old Malays.. Int J Paediatr Dent 2008. [Google Scholar]
- M Kermani, T Yazdi, A Haghighi. . Evaluation of the accuracy of Demirjian's method for estimating chronological age from dental age in 2019. [Google Scholar]
- CM Nolla. The development of permanent teeth (Doctoral dissertation). . [Google Scholar]
- K Haavikko. The formation and the alveolar and clinical eruption of the permanent teeth.. Suom Hammaslaak Toim 1970. [Google Scholar]
- A Demirjian, H Goldstein, JM Tanner. A new system of dental age assessment.. Hum Biol 1973. [Google Scholar]
- G Willems, AV Olmen, B Spiessens, C Carels. Dental age estimation in Belgian children: Demirjian's technique revisited. J Forensic Sci 2001. [Google Scholar]
- M Maber, HM Liversidge, MP Hector. Accuracy of age estimation of radiographic methods using developing teeth.. Forensic Sci Int 2006. [Google Scholar]
- B Rai, SC Anand. Tooth developments: an accuracy of age estimation of radiographic methods. World J Med Sci 2006. [Google Scholar]
- M Priyanka, G Kiran, R Poornima, R Shravani, KC Shobhita, P Preethi. Age Estimation by Modified Demirjian’s Method in Children and Adolescents of Hyderabad Population-A Panoramic Study. J Orofac Sci 2018. [Google Scholar]
- LW Graber, R L Vanarsdall, K W Vig, G J Huang. . Orthodontics-e-book: current principles and techniques 2000. [Google Scholar]
- F De Micco, F Martino, V Palacio, LA Cingolani, M Campobasso. Third molar maturity index and legal age in different ethnic populations: Accuracy of Cameriere’s method. . Med Sci Law 2021. [Google Scholar]
- RE Stewart, TH Barber, KC Trourman, SH Wei. . Pediatric dentistry-Scientific foundations and clinical practice-, the CV Mosby Co 1982. [Google Scholar]
- U Jaeger. Dental age in dependence on the stage of selected physiological developmental parameters. Deutsche Stomatologie 1990. [Google Scholar]
- S Poulsen, G Koch, I Espelid, D Haubek. . Pediatric dentistry: a clinical approach 2001. [Google Scholar]
- SE Bishara, WB Saunders. . Textbook of orthodontics. 2001. [Google Scholar]
- SK Nanda. Patterns of vertical growth in the face. Am J Orthod Dentofac Orthop 1988. [Google Scholar]
- SK Nanda, TK Rowe. Circumpubertal growth spurt related to vertical dysplasia.. The Angle Orthod 1989. [Google Scholar]
- LS Neves, A Pinzan, G Janson, CE Canuto, MR De Freitas, RH Cançado. Comparative study of the maturation of permanent teeth in subjects with vertical and horizontal growth patterns.. Am J Orthod Dentofac Orthoped 2005. [Google Scholar]
- GM Jamroz, AM Kuijpers-Jagtman, MA Hof, C Katsaros. Dental Maturation in Short and Long Facial Types: Is There a Difference?. The Angle Orthodontist 2006. [Google Scholar]
- GR Janson, DR Martins, O Tavano, EA Dainesi. Dental maturation in subjects with extreme vertical facial types. . Eur J Orthod 1998. [Google Scholar]
- A B Acharya. . Age Estimation in Indians Using Demirjian’s 8-teeth Method 2011. [Google Scholar]
- RM Eid, R Simi, MN Friggi, M Fisberg. Assessment of dental maturity of Brazilian children aged 6 to 14 years using Demirjian's method.. Int J Paediatr Dent 2002. [Google Scholar]
- S Koshy, S Tandon. Dental age assessment: the applicability of Demirjian's method in south Indian children.. Forensic Sci Int 1998. [Google Scholar]
- MM Cortés, R Rojo, EA García, MR Martínez. Accuracy assessment of dental age estimation with the Willems, Demirjian and Nolla methods in Spanish children: Comparative cross-sectional study. . BMC Pediatr 2020. [Google Scholar]
- V Goyal, DN Kapoor, S Kumar, M Sagar. Maturation of permanent teeth in different facial types: A comparative study. Indian J Dent Res 2011. [Google Scholar]
- A M Sierra. Assessment of dental and skeletal maturity: a new approach.. Angle Orthod 1987. [Google Scholar]
- U Hägg, J Taranger. Maturation indicators and the pubertal growth spurt. Am Jf Orthod 1982. [Google Scholar]
- V Bolantos En. The relationship between dental age, bone age and chronological age in 54 children with short familial stature.. Int JPaediatric Dent 1997. [Google Scholar]
- S Chertkow. Tooth mineralization as an indicator of the pubertal growth spurt.. Am J Orthod 1980. [Google Scholar]
- V Rai, S Saha, G Yadav, AM Tripathi, K Grover. Dental and skeletal maturity-a biological indicator of chronologic age. J Clin Diagn Res 2014. [Google Scholar]