Introduction
Cephalometric radiography, subsequent to its introduction in 1931, became an indispensable tool in orthodontic diagnosis and treatment planning.1 Though there is a recent shift towards three-dimensional cephalometrics, conventional two-dimensional cephalometry to diagnose, plan treatment, assess treatment progress and results remains valid even today.
Cephalometric standard norms are highly essential to exploit the full potential of cephalometrics in diagnosis and treatment planning. It is well recognized that there are significant variations in the dentofacial features among different ethnic groups.2, 3 Thus, it is apparent that the norms developed for a particular population cannot be applied universally and this holds true particularly for countries like India, where there are multiple ethnic admixtures.4, 5, 6
Regional cephalometric norms allow clinicians to compare a patient's cephalometric data to those of individuals from the same ethnic or geographic background. This facilitates a more precise evaluation of deviations from the established norm. Treating a patient to a cephalometric standard not developed for that particular population might result in suboptimal treatment outcomes. By incorporating regional norms, clinicians can account for these ethnic differences and provide more culturally sensitive and effective treatment.
Over the years, several regional cephalometric standards have been derived and published for the Indian population, mostly as post-graduate dissertations. There are multiple available standard norms for a single parameter and this can create perplexity, especially in the young minds regarding which one to use. A clarity in this perspective is thus essential for treatment planning and research. Hence, the aim of the present study was to derive region-wise pooled mean and standard deviation (SD) for the most commonly used and relevant lateral cephalometric parameters and to compare these norms between populations of different regional sub-divisions of India.
Materials and Methods
The study was approved by the Institutional Ethics Committee (IEC/M/22/2021/DCK) and the protocol was registered in the International Prospective Register of Systematic Reviews (CRD42022328622). A thorough electronic literature search was performed in Google, Google Scholar, Medline (via PubMed), and Scopus using keywords such as “cephalometric”, “regional”, “Indian”, “norm”, “Steiner”, “Downs”, “Tweed”, “Wits”, “McNamara”, “Ricketts”, “Burstone”, “Arnett”, and “Pancherz”. The search strategy used in PubMed is elaborated in supplementary table (Table S1), which was customised and applied to other databases. Grey literature search was carried out for unpublished thesis and dissertations. Hand search of the journals of the Indian Orthodontic Society (IOS), Indian Dental Association, state dental journals, and the handbook of cephalometric norms for the Indian ethnic groups published by the IOS7 was also performed.
The data collected were grouped according to the region of study into four categories namely, South Indian (SI), North Indian (NI), Central and West (CW) Indian, and North-East (NE) Indian.8 The inclusion criteria included those studies in which regional Indian norms were derived for subjects over 18 years and where sample size was mentioned and adequate.
To identify the most frequently used cephalometric parameters in routine orthodontic practice, an online survey was conducted using a Google form, which was sent via email. A convenient sampling strategy was adopted for the survey. Respondents were senior orthodontic clinicians and academicians with over 10 years of experience. The questions for the survey comprised different lateral cephalometric parameters from various analysis. The parameters were selected in such a way that they represent the different skeletal, dental, and soft-tissue characteristics. The respondents were asked to select the parameters for each category on a priority basis. A list of parameters were identified on the basis of the selection, which was subjected to peer review by a panel of eight experts to ensure preliminary form of content and face validity. In case of the parameters where there were no sufficient number of studies to derive the pooled data, the available data were presented as such.
Statistical analysis
The pooled Mean and pooled SD for each parameter were calculated using the following formulae:
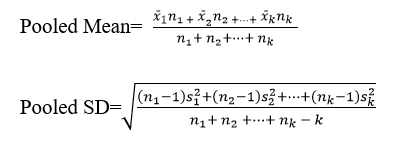
Each of the selected parameters were compared between groups and with standard norms. Forest plots were derived for each comparison using RevMan 5.4.9 The significance level was set at 5%.
Results
The online questionnaire included 75 lateral cephalometric parameters. A total of 42 responses were received, out of the 50 forms circulated (response rate= 84%). The survey period lasted one month from June 9, 2022 to July 10, 2022. The mean age of the respondents was 47.2 years (SD= 5.4) having a mean experience of 12.2 years (SD= 1.7). The fifty most recommended cephalometric parameters were shortlisted and was subjected to validation by the expert committee of eight members. This included two post-graduate students, two clinicians experienced less than five years, two clinicians between five and 15 years, and two over 15 years. The committee, after resolving conflicts, recommended 44 parameters to be included in the final list for data pooling.
The four regional sub-divisions and the states under each category are presented in false. The literature search yielded a total of 9693 records. After screening and assessment for eligibility, 137 regional lateral cephalometric studies were included. Figure 2 depicts the PRISMA flowchart.
The estimated pooled mean and SD of the shortlisted parameters for the four regional sub-divisions are presented in Table 2. Statistical comparisons of the regional norms between different population groups are shown in Figure 3, Figure 4, Figure 5, Figure 6, Figure 7, Figure 8.


Figure 3
Forestplots depicting significant comparisons between South Indians and Central-WestIndians


Table 1
Regional Sub-divisions8
Table 2
Master table showing the derived regional norms for the indian population
Discussion
The effective use of cephalometrics for orthodontic diagnosis and treatment planning relies on the availability of norms for various skeletal, dental, and soft tissue structures. It has well been established that the concepts of esthetics, perception of treatment need and skeletal, dental and soft tissue facial characteristics vary from race to race, region to region and also within the same region with diverse cultures, as in India.10, 11 Hence, applying standard norms universally to treat all patients may not be functionally and esthetically acceptable, as ‘one size fits all’ concept cannot be applied here.
India has 28 states and 8 Union Territories, divided into different zones namely the North, South, East, West, Central, and North-East8 The norms developed for a particular population need not necessarily be applicable for another population. Segner and Hasund 12 introduced the term “floating norms” to represent variations in the individual norms according to changes in the other correlated cephalometric parameters of an individual. The craniofacial pattern of an individual exhibits correlations among the anterio-posterior and vertical cephalometric parameters. These correlations are more important than any single isolated parameter. The concept of floating norms involves establishing separate reference standards for different demographic groups within a population. These norms "float" or adapt according to the specific characteristics of each group, rather than relying on a single universal standard.
In India, regional cephalometric norms have been established from time to time. Multiplicity of studies have led to derivation of more than one norm for a single parameter making it confusing for young graduates, those engaged in research, as well as those preparing for board examinations. The present study attempted to derive pooled mean and SD values for the 44 commonly used skeletal, dental, and soft tissue lateral cephalometric parameters from the available published regional norms for the Indian population belonging to four different ethnic origins. To our knowledge, this is the first attempt to compile all the published studies, derive pooled mean and SD for the most common and relevant lateral cephalometric parameters, and perform a meta-analysis.
The response rate of the online survey was found to be high (84%) comparatively 13, 14 This may be due to the influence through personal contacts. The orthodontists having ten years or over clinical experience were selected for the survey. The expert panel included members having different levels of experience. This ensured adequate representation, confirming a preliminary form of content and face validity.
Statistical comparisons between different groups were made for each parameter, subject to data availability from original studies. The results of the present study indicated that the pooled mean and SD for most parameters differed between population groups. The relevant findings are discussed below:
Position of maxilla and mandible
The mean and SD values of SNA for the South (M= 82.74±2.07, F= 82.80±2.05) and CW (M= 82.7±4.04, F= 82.87±3.97) Indian population were similar to each other and also to the standard Caucasian norm of 82o.15, 16 As well, there existed no gender difference, indicating no differences in the position of maxillary apical base among these population groups.However, the NE Indians showed a greater SNA (M= 84.86±3.29, F= 84.14±2.91)than the standard and other populations, showing a more forward position of maxilla among the NE Indians.
The SNA of NI males (81.68±4.71) and females (81.15±3.26) were slightly less than the original norm as well as other population groups. The difference was more marked when compared to NE Indians.
The changes in the SNB mean values showed a similar trend to that of the SNA among the different groups.
The distance of point A and Pog from N perpendicular for the SI males (N per. A= -0.65±3.22, N per. Pog= -6.5±5.32) and females (N per. A= -0.19±3.53, N per. Pog= -5.48±5.51) were greater than that of the original norm, 17 indicating a more posterior position of maxilla and mandible in the former. However, it should be noted that the studies18, 19 considered for the pooled estimate of these parameters included samples aged less than 18 years when compared to the standard norms with subjects between 26 and 30 years.17 This might have accounted for the difference.
On meta-analysis, it was found that SI and NI showed statistically significant differences (P< 0.05) in SNA and SNB (P< 0.05) (Figure 3), indicating the difference in maxillary and mandibular positions between the two population groups. Likewise, significant differences (P< 0.05) existed between NI and NE.Figure 8 On the other hand, CW and SI showed close resemblance.
Position and rotation of the mandibular base
The SI (124.39±7.26) and NI (124.67±7.79) females were found to have almost similar saddle angle, while the highest was recorded for the NI males (128.46±6.97), which was greater than the original norm.20 This showed a more posterior position of the mandible among the NI males.
The changes in the articular angle showed a different trend with the South (138.89±8.2) and NI (139.53±6.78) males sharing similar values, while the NI females had the highest (143.73±8.56). However, the latter is in accordance with the original norm, 20 while others were lesser than the standard.
The lower gonial angle was found to be almost similar among SI (M= 68.54±4.99, F= 69.07±4.47) and NI (M= 69.51±3.94, F= 69.64±3.67), with a marginal decrease in the SI males. However, all values were below the standard norms.
Length of the skeletal bases
The effective maxillary and mandibular lengths and the maxillo-mandibular differential as measured in the McNamara analysis 17 were found to be slightly increased in the SI males (82.81±7.31, 100.66±11.17 and 21.4±3.4 respectively) when compared to the SI females (81.6±7.27, 100.02±8.97 and 21.30±4.03 respectively). However, all these values were smaller than their corresponding original norms.17
Sagittal skeletal relation
The ANB value for the Indian population was found to be greater than the standard 2o, 21 except for the CW Indian males (1.91).
The ANB of SI (M= 2.75±1.41, F= 2.62±1.5) were slightly greater than NI (M= 2.28±1.97, F= 2.28±1.61). Central Indians showed the least (M= 1.91±2.07, F= 2.06±1.95), while NE had the highest (M= 3.37±1.29, F= 2.65±1.47).
The Wits appraisal of SI (-0.37±1.87) was greater than that of NI (-0.82±2.93), indicating a more Class III relationship in NI compared to SI. This was in line with the ANB values in both groups.
CW Indians were found to have a slightly increased beta angle than the South, whereas the YEN angle was found to be similar for both groups. However, both these angles were within their corresponding standard ranges.22, 23
The facial angle as measured in the Downs’ analysis was found to be almost similar for the four groups and also to the original Caucasian norm.24
In contrast to the above, the angle of convexity showed wide variations among the four groups, with the SI having the lowest value (2.6±2.63) and the NE showing the highest. 5, 6
Meta-analysis of the ANB, Beta angle, and Wits appraisal between different population groups found statistically significant differences between SI and NI (Figure 3), SI and CW (Figure 4), while NI and NE were found to be similar. These findings are in contrast to that found in the position of maxilla and mandible, assessed in terms of SNA and SNB. This delineates the fact that a single parameter may not be reliable in determining the relationships. A minimum of two or more are warranted to derive an inference.
Vertical skeletal relation
The Y axis showed differences among the groups with the NE Indians exhibiting the highest (63.24) followed by the CW Indian males (61.58±8.66), while the CW Indian females showed the lowest (58.35±8.54). In contrast, the NI males (22.82±4.94) showed the least FMA, while the highest was for the SI females (27.31±4.84). All these values were, however, within their respective standard normal ranges. 24, 25
Meta-analysis found a statistically significant difference in FMA of SI with NI (M: P= 0.0003, F: P= 0.02) (Figure 3) as well as CW (M: P< 0.00001, F: P< 0.0001) (Figure 4). NE Indians were also significantly different from CW (M: P= 0.0005, F: P= 0.01) (Figure 7) and NI males (P= 0.003) (Figure 8). On the other hand, NI and CW were similar.
Upper and lower incisor position and inclination
The upper and lower incisor proclination as measured by upper 1 to NA and lower 1 to NB angulations were found to be the lowest for the NI males (21.59; 23.33) and females (23.73; 23.8) compared to other groups. This was reflected by a decrease in their respective linear measurements and increase in the interincisal angle (M= 129.26±8.51; F= 127.56±8.84).
The upper incisor proclination was highest for SI (M= 27.46±4.2, F= 27.41±6.16) and CW (M= 27.55±6.17, F= 27.2±5.6) and the NE recorded the highest lower incisor proclination (M= 29.94±6.27, F= 28.57±6.24). The values were also found to be higher than the original norm.15, 16
In contrast, IMPA was found to be highest for the NI (M= 102.48±7.95, F= 101±8.2). and least for NE (97.04±6.93).
Meta-analysis revealed that NE Indians and CW were found to have statistically significant differences in the upper incisor position and angulation (Figure 7). The SI were also statistically different from NE (Figure 5). However, SI were no different from CW and NI were no different from NE.
Soft tissue relation
The Indian norms for upper and lower lip positions were found to be greater than the corresponding Caucasian norms.26, 27 The CW males had retrusive lower lips (lower lip to e line= -1.02±2.71) compared to other groups. Among the SI, males (S line to upper/lower lip= 1.55±0.92/ 2.84±1.68) had more protrusive lips than females (S line to upper/lower lip= 1.33±0.98/ 2.59±1.67). The H angle was found to be the highest for the NI females (16.34±3.66). The nasolabial angle (NLA) of the SI (M= 106.58±11.3; F= 102.37±14.82) was found to be within the standard limits. 28
Results from meta-analysis showed a statistically significant difference in NLA and lower lip to e-line distance of different population groups when compared with the standard norms. Within-population comparisons showed a significant difference between SI and NI males (P= 0.0001) in the NLA (Figure 3) and the corresponding females (P< 0.00001) in lower lip to e-line distance. The SI and CW showed no significant difference.
In summary, the antero-posterior position of maxilla (SNA) and mandible (SNB) were found to be cephalometrically similar in SI and CW. The SI were found to have a more convex skeletal profile compared to NI, who showed the least convexity. The jaw bases were smaller among all sub-groups of the Indian population compared to Caucasians. The upper incisors were most proclined in SI and least among NI. SI were found to have more procumbent upper and lower lips compared to other sub-groups.
These findings indicate that there are significant morphological differences among different population groups. This delineate the fact that a single set of norms may not be applicable for all. It is important to consider region-specific cephalometric norms for orthodontic treatment planning, not forgetting the fact that soft tissue facial esthetics is the ultimate goal.
Limitations and Future Direction
Extensive literature search was performed to derive the pooled data. There is a dearth of studies on NE Indians and to an extent on CW. Hence, future studies may focus on these sub-groups.
It is pertinent to note that the validity of the pooled cephalometric norms is only as good as the soundness of the original studies. As well, the ethnic influence in cephalometric values should not be overlooked. The inherent errors in cephalometry and its limitations in diagnosis and treatment planning also has to be borne in mind when applying these norms clinically.29, 30
Conclusions
The following conclusions were drawn:
Maxilla and mandible were more prognathic for South Indians than North Indians. North-East Indians showed maximum maxillary and mandibular prognathism.
The maxillary and mandibular skeletal base lengths of Indians were smaller than Caucasians.
The North Indians and North-East Indians showed similar sagittal skeletal base relationships, while the South Indians had a more Class II tendency compared to North Indians.
The growth pattern was found to be more vertical in the South Indians and North-East Indians compared to others.
The upper and lower incisor proclinations were least for North Indians, while South Indians demonstrated maximum upper incisor proclination and North-East Indians had the highest lower incisor proclination.