- Visibility 40 Views
- Downloads 9 Downloads
- DOI 10.18231/j.jco.2023.032
-
CrossMark

Establishing cephalometric norms using Arnett's soft tissue analysis for males and females of Jaipur population
Introduction
In orthodontics, the early texts of Angle and Case bear proof that facial form and esthetics were always an important consideration of the art and science. Human face is a complex mosaic of lines, angles, planes, shapes, textures and colors. Soft tissue cephalometrics is a method of quantifying facial disharmony and identifying its underlying causes. Recently, facial balance, beauty, diagnosis and treatment planning have been improved by Dr. G.W. Arnett by means of combination of clinical facial analysis[1], [2] and Soft tissue cephalometrics (STCA).[3], [4] The present study is being done to establish the soft tissue cephalometric norms of facial region in the ethnic group of Jaipur population.[5]
Aim and Objectives
Based on Arnett’s soft tissue cephalometric analysis (STCA), the present study aims to establish the facial soft tissue cephalometric norms for Jaipur population.
To determine and compare soft tissue cephalometric norms between male and female population of Jaipur.
To determine and compare soft tissue cephalometric norms for Jaipur population with Arnett’s soft tissue cephalometric norms.
Materials and Methods
This study was carried out in the Department of Orthodontics and Dentofacial Orthopedics, NIMS Dental College and Hospital, Jaipur, Rajasthan. A total of 100 subjects (50 males and 50 females) with pleasing and well balanced straight profile on extra oral examination were selected. The ethical clearance for the study was obtained from the Ethical and Scientific Committee of NIMS University. The selected subjects were situated in different part of Jaipur city to ensure uniform representation of the entire Jaipur population.
Digital Lateral cephalograms were taken using Kodak 8000C Panoramic and Cephalometric unit by positioning the subjects in the natural head position with teeth in maximum intercuspation and lips in the rest position.
The analysis was carried out by using conventional tracing method by a single operator and the results were compared to the norms established by Arnett et al in 1999.
Inclusion criteria
Age between 18 -25 years
Acceptable and pleasing profile and Angles Class-I molar relationship on both sides
Normal overjet and overbite with minimal crowding/ spacing / rotation (<3mm)
All the teeth erupted excluding the third molars
Exclusion criteria
History of orthodontic treatment or plastic surgery
Missing Teeth
Class II or class III Skeletal bases.
Retained deciduous teeth.
Moderate or Severe Crowding.
As per arnett’s study the findings are discussed under the 4 headings
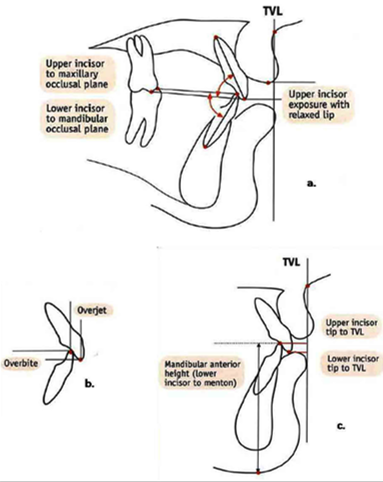
Dentoskeletal factors ([Figure 1])-Mx occlusal plane to TVL , Mx1 to Mx occlusal plane, Md1 to Md occlusal plane, Overjet (OJ), Overbite (OB)
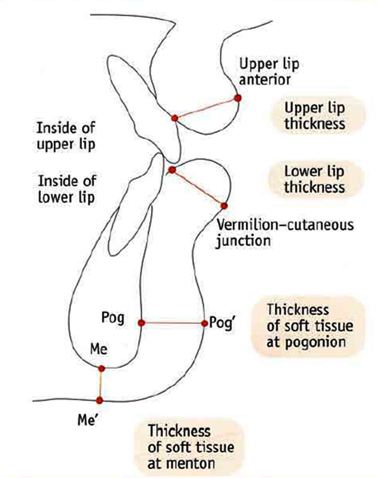
Soft tissue structures ([Figure 2])-Upper lip thickness (Upper Lip Anterior [ULA] to Upper Lip Inside), Lower lip thickness (Lower Lip Outside to Lower Lip Inside), Pogonion-Pogonion’ (Pog – Pog’), Menton-Menton’ (Me – Me’), Upper lip angle (Sn-Upper Lip Anterior [ULA]to TVL), Nasolabial angle (Sn-Upper Lip Anterior[ULA] to Sn-Columella)
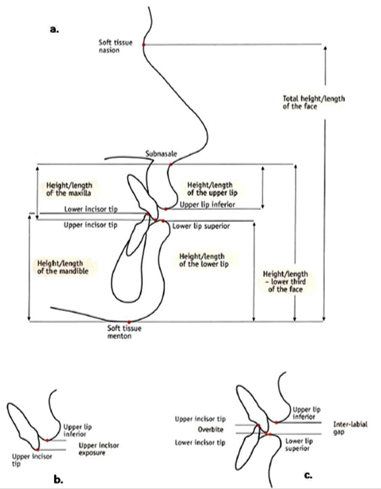
Facial lengths ([Figure 3])- Facial height (Nasion’-Menton’ [Na’ – Me’]), Upper lip length (Upper Lip Inferior [ULI] to Sn), Interlabial gap (ILG), Lower lip length [LLL] (Lower lip Superior [LLS] to Me’), Lower 1/3 of face (Sn to Me’), Overbite (OB), Mx1 exposure, Maxillary height (Sn to tip of Mx1), Mandibular height (Me’ to tip of Md1)
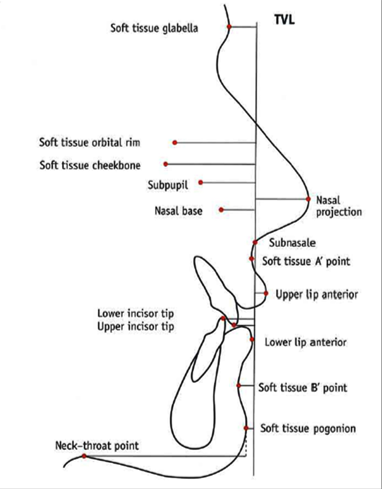
Projections to True Vertical Line ([Figure 4]) - Glabella (G’), Orbital rims (OR’), Cheek bone (CB’), Subpupil (SP’), Alar base (AB), Nasal projection, Subnasale (Sn), A point’, Upper lip anterior (ULA), Maxillary Incisor (Mx1), Mandibular Incisor (Md1), Lower lip anterior (LIA), B point’, Pogonion’ (Pog’)
Data Management & Statistical Analysis
All the values were tabulated in Microsoft Excel and Statistical analysis was carried out using the software statistical analysis SPSS (statistical package for social sciences) version 1BM SSPA statistics V.20.0.
Mean and standard deviation of various landmarks were calculated. Independent sample t-test was used for comparison between males and females as well as comparison between Arnett’s values and study values. P value less than 0.05 was considered to be statistically significant.
|
Parameters |
Gender |
Mean |
S.D. |
t-value |
P- value |
Mean Difference |
|
Dentoskeletal Factors |
||||||
|
Mxocclusal plane |
Male |
99.05 |
3.55 |
-1.25 |
0.217 |
-0.96 |
|
|
Female |
100.01 |
2.55 |
|
|
|
|
Mx1 to MxOP |
Male |
54.42 |
4.92 |
-0.02 |
0.982 |
-0.03 |
|
|
Female |
54.44 |
5.19 |
|
|
|
|
Md1 to MdOP |
Male |
65.96 |
4.99 |
-1.04 |
0.301 |
-1.47 |
|
|
Female |
67.43 |
6.20 |
|
|
|
|
Overjet |
Male |
3.24 |
1.00 |
0.47 |
0.641 |
0.10 |
|
|
Female |
3.14 |
0.74 |
|
|
|
|
Overbite |
Male |
1.94 |
1.53 |
-1.55 |
0.126 |
-0.55 |
|
|
Female |
2.49 |
1.32 |
|
|
|
|
Soft Tissue Structures |
||||||
|
Upper lip thickness |
Male |
12.39 |
1.94 |
2.26 |
0.027* |
0.98 |
|
|
Female |
11.42 |
1.47 |
|
|
|
|
Lower lip thickness |
Male |
10.37 |
1.52 |
1.19 |
0.238 |
0.43 |
|
|
Female |
9.93 |
1.37 |
|
|
|
|
Pogonion-Pogonion' |
Male |
12.03 |
1.94 |
0.22 |
0.827 |
0.10 |
|
|
Female |
11.92 |
1.82 |
|
|
|
|
Menton-Menton' |
Male |
9.28 |
2.33 |
0.43 |
0.667 |
0.25 |
|
|
Female |
9.03 |
2.23 |
|
|
|
|
Nasolabial angle |
Male |
109.24 |
22.99 |
0.39 |
0.700 |
1.72 |
|
|
Female |
107.52 |
10.25 |
|
|
|
|
Upper lip angle |
Male |
1.14 |
7.33 |
0.16 |
0.871 |
0.36 |
|
|
Female |
0.78 |
10.22 |
|
|
|
|
Facial Length |
||||||
|
Nasion'-Menton' |
Male |
116.35 |
6.61 |
4.46 |
0.000* |
6.88 |
|
|
Female |
109.47 |
5.70 |
|
|
|
|
Upper lip length |
Male |
20.65 |
2.24 |
4.38 |
0.000* |
2.10 |
|
|
Female |
18.55 |
1.53 |
|
|
|
|
Interlabial gap |
Male |
0.92 |
0.65 |
-0.13 |
0.895 |
-0.02 |
|
|
Female |
0.93 |
0.47 |
|
|
|
|
Lower lip length |
Male |
43.84 |
3.23 |
3.59 |
0.001* |
2.75 |
|
|
Female |
41.09 |
2.89 |
|
|
|
|
Lower 1/3 of face |
Male |
65.39 |
4.93 |
4.52 |
0.000* |
4.83 |
|
|
Female |
60.56 |
3.50 |
|
|
|
|
Overbite |
Male |
1.94 |
1.53 |
-1.55 |
0.126 |
-0.55 |
|
|
Female |
2.49 |
1.32 |
|
|
|
|
Mx1 exposure |
Male |
2.22 |
1.12 |
-0.87 |
0.390 |
-0.26 |
|
|
Female |
2.48 |
1.24 |
|
|
|
|
Maxillary height |
Male |
22.86 |
2.55 |
3.06 |
0.003* |
1.85 |
|
|
Female |
21.01 |
2.28 |
|
|
|
|
Mandibular height |
Male |
44.45 |
3.31 |
3.20 |
0.002* |
2.43 |
|
|
Female |
42.02 |
2.74 |
|
|
|
|
Parameters |
Gender |
Mean |
S.D. |
t-value |
P- value |
Mean Difference |
|
Projections To TVL |
||||||
|
Glabella |
Male |
-5.24 |
3.49 |
-1.39 |
0.169 |
-1.14 |
|
|
Female |
-4.10 |
3.08 |
|
|
|
|
Orbital rims |
Male |
-20.73 |
2.81 |
-5.66 |
0.000* |
-3.98 |
|
|
Female |
-16.74 |
2.82 |
|
|
|
|
Cheek bone |
Male |
-24.65 |
3.97 |
-5.92 |
0.000* |
-5.38 |
|
|
Female |
-19.28 |
3.26 |
|
|
|
|
Subpupil |
Male |
-16.43 |
6.16 |
-3.00 |
0.004* |
-3.58 |
|
|
Female |
-12.85 |
2.76 |
|
|
|
|
Alar base |
Male |
-11.09 |
5.06 |
-1.60 |
0.114 |
-1.51 |
|
|
Female |
-9.58 |
1.70 |
|
|
|
|
Nasal Projection |
Male |
14.70 |
1.96 |
0.95 |
0.347 |
0.41 |
|
|
Female |
14.29 |
1.42 |
|
|
|
|
Subnasale |
Male |
0.00 |
0.00 |
-1.13 |
0.261 |
-0.06 |
|
|
Female |
0.06 |
0.28 |
|
|
|
|
A point' |
Male |
-1.84 |
1.18 |
-0.24 |
0.812 |
-0.08 |
|
|
Female |
-1.76 |
1.52 |
|
|
|
|
Upper lip anterior |
Male |
1.37 |
1.61 |
0.83 |
0.411 |
0.37 |
|
|
Female |
1.00 |
1.97 |
|
|
|
|
Mx1 |
Male |
-12.17 |
5.16 |
-1.33 |
0.189 |
-1.32 |
|
|
Female |
-10.86 |
2.20 |
|
|
|
|
Md1 |
Male |
-16.25 |
2.17 |
-4.20 |
0.000* |
-2.26 |
|
|
Female |
-14.00 |
2.13 |
|
|
|
|
Lower lip anterior |
Male |
-2.53 |
2.20 |
-0.94 |
0.349 |
-0.53 |
|
|
Female |
-2.00 |
2.25 |
|
|
|
|
B point' |
Male |
-9.93 |
2.68 |
-2.57 |
0.013* |
-1.57 |
|
|
Female |
-8.36 |
2.18 |
|
|
|
|
Pogonion' |
Male |
-7.88 |
3.10 |
-2.69 |
0.009* |
-2.08 |
|
|
Female |
-5.79 |
3.09 |
|
|
|
|
Parameters |
Gender |
Present Study |
Arnett et al. 1999 |
t - Value |
P-Value |
||
|
Mean |
SD |
Mean |
SD |
||||
|
Dentoskeletal factors |
|||||||
|
Mxocclusal plane |
Male |
99.05 |
3.55 |
95.6 |
1.8 |
3.976 |
0.001* |
|
|
Female |
100.01 |
2.55 |
95.0 |
1.4 |
8.238 |
0.000* |
|
Mx1 to MxOP |
Male |
54.42 |
4.92 |
56.8 |
2.5 |
1.901 |
0.066 |
|
|
Female |
54.44 |
5.19 |
57.8 |
3.0 |
2.667 |
0.011* |
|
Md1 to MdOP |
Male |
65.96 |
4.99 |
64.3 |
3.2 |
1.211 |
0.234 |
|
|
Female |
67.43 |
6.20 |
64.0 |
4.0 |
2.185 |
0.035* |
|
Overjet |
Male |
3.24 |
1.00 |
3.2 |
0.4 |
0.164 |
0.870 |
|
|
Female |
3.14 |
0.74 |
3.2 |
0.6 |
0.288 |
0.775 |
|
Overbite |
Male |
1.94 |
1.53 |
3.2 |
0.7 |
3.668 |
0.002* |
|
|
Female |
2.49 |
1.32 |
3.2 |
0.7 |
2.281 |
0.028* |
|
Soft Tissue Structures |
|||||||
|
Upper lip thickness |
Male |
12.39 |
1.94 |
12.6 |
1.8 |
0.366 |
0.739 |
|
|
Female |
11.42 |
1.47 |
14.8 |
1.4 |
7.456 |
0.000* |
|
Lower lip thickness |
Male |
10.37 |
1.52 |
13.6 |
1.4 |
6.622 |
0.000* |
|
|
Female |
9.93 |
1.37 |
15.1 |
1.2 |
12.848 |
0.000* |
|
Pogonion-Pogonion' |
Male |
12.03 |
1.94 |
11.8 |
1.5 |
0.401 |
0.691 |
|
|
Female |
11.92 |
1.82 |
13.5 |
2.3 |
2.332 |
0.025* |
|
Menton-Menton' |
Male |
9.28 |
2.33 |
7.4 |
1.6 |
2.866 |
0.007* |
|
|
Female |
9.03 |
2.23 |
8.8 |
1.3 |
-4.607 |
0.701 |
|
Nasolabial angle |
Male |
109.24 |
22.99 |
103.5 |
6.8 |
1.063 |
0.295 |
|
|
Female |
107.52 |
10.25 |
106.4 |
7.7 |
0.403 |
0.689 |
|
Upper lip angle |
Male |
11.14 |
7.33 |
12.1 |
5.1 |
5.280 |
0.000* |
|
|
Female |
0.78 |
10.22 |
8.3 |
5.4 |
12.092 |
0.000* |
|
Facial Length |
|||||||
|
Nasion'-Menton' |
Male |
116.35 |
6.61 |
124.6 |
4.7 |
4.374 |
0.000* |
|
|
Female |
109.47 |
5.70 |
137.7 |
6.5 |
14.302 |
0.000* |
|
Upper lip length |
Male |
20.65 |
2.24 |
21.0 |
1.9 |
0.507 |
0.615 |
|
|
Female |
18.55 |
1.53 |
24.4 |
2.5 |
8.417 |
0.000* |
|
Interlabial gap |
Male |
0.92 |
0.65 |
3.3 |
1.3 |
6.672 |
0.000* |
|
|
Female |
0.93 |
0.47 |
2.4 |
1.1 |
7.095 |
0.000* |
|
Lower lip length |
Male |
43.84 |
3.23 |
46.9 |
2.3 |
3.318 |
0.002* |
|
|
Female |
41.09 |
2.89 |
54.3 |
2.4 |
16.728 |
0.000* |
|
Lower 1/3 of face |
Male |
65.39 |
4.93 |
71.1 |
3.5 |
4.061 |
0.000* |
|
|
Female |
60.56 |
3.50 |
81.1 |
4.7 |
5.202 |
0.000* |
|
Overbite |
Male |
1.94 |
1.53 |
3.2 |
0.7 |
3.668 |
0.002* |
|
|
Female |
2.49 |
1.32 |
3.2 |
0.7 |
2.281 |
0.028* |
|
Mx1 exposure |
Male |
2.22 |
1.12 |
4.7 |
1.6 |
5.249 |
0.000* |
|
|
Female |
2.48 |
1.24 |
3.9 |
1.2 |
3.678 |
0.001* |
|
Parameters |
Gender |
Present Study |
Arnett et al. 1999 |
t - Value |
P-Value |
||
|
|
|
Mean |
SD |
Mean |
SD |
|
|
|
Maxillary height |
Male |
22.86 |
2.55 |
25.7 |
2.1 |
3.666 |
0.000* |
|
|
Female |
21.01 |
2.28 |
28.4 |
3.2 |
7.902 |
0.000* |
|
Mandibular height |
Male |
44.45 |
3.31 |
48.6 |
2.4 |
4.368 |
0.000* |
|
|
Female |
42.02 |
2.74 |
56.0 |
3.0 |
13.112 |
0.000* |
|
Projections To TVL |
|||||||
|
Glabella |
Male |
-5.24 |
3.49 |
-8.5 |
2.4 |
3.316 |
0.002* |
|
|
Female |
-4.10 |
3.08 |
-8 |
2.5 |
5.617 |
0.000* |
|
Orbital rims |
Male |
-20.73 |
2.81 |
-18.7 |
2.0 |
2.531 |
0.016* |
|
|
Female |
-16.74 |
2.82 |
-22.4 |
2.7 |
5.617 |
0.000* |
|
Cheek bone |
Male |
-24.65 |
3.97 |
-20.6 |
2.4 |
3.786 |
0.001* |
|
|
Female |
-19.28 |
3.26 |
-25.2 |
4.0 |
12.456 |
0.000* |
|
Subpupil |
Male |
-16.43 |
6.16 |
-14.8 |
2.1 |
1.109 |
0.275 |
|
|
Female |
-12.85 |
2.76 |
-18.4 |
1.9 |
7.725 |
0.000* |
|
Alar base |
Male |
-11.09 |
5.06 |
-12.9 |
1.1 |
1.559 |
0.128 |
|
|
Female |
-9.58 |
1.70 |
-15.0 |
1.7 |
10.034 |
0.000* |
|
Nasal Projection |
Male |
14.70 |
1.96 |
16.0 |
1.4 |
2.032 |
0.027* |
|
|
Female |
14.29 |
1.42 |
17.4 |
1.7 |
62.305 |
0.000* |
|
Subnasale |
Male |
0.00 |
0.00 |
0.0 |
0.0 |
0.0 |
0.0 |
|
|
Female |
0.06 |
0.28 |
0.0 |
0.0 |
1.013 |
0.277 |
|
A point' |
Male |
-1.84 |
1.18 |
-0.1 |
1.0 |
4.789 |
0.000* |
|
|
Female |
-1.76 |
1.52 |
-0.3 |
1.0 |
3.763 |
0.001* |
|
Upper lip anterior |
Male |
1.37 |
1.61 |
3.7 |
1.2 |
4.977 |
0.000* |
|
|
Female |
1.00 |
1.97 |
3.3 |
1.7 |
4.008 |
0.000* |
|
Mx1 |
Male |
-12.17 |
5.16 |
-9.2 |
2.2 |
2.329 |
0.026* |
|
|
Female |
-10.86 |
2.20 |
-12.1 |
1.8 |
1.992 |
0.053* |
|
Md1 |
Male |
-16.25 |
2.17 |
-12.4 |
2.2 |
5.249 |
0.000* |
|
|
Female |
-14.00 |
2.13 |
-15.4 |
1.9 |
2.215 |
0.033* |
|
Lower lip anterior |
Male |
-2.53 |
2.20 |
1.9 |
1.4 |
7.348 |
0.000* |
|
|
Female |
-2.00 |
2.25 |
1.0 |
2.2 |
4.255 |
0.000* |
|
B point' |
Male |
-9.93 |
2.68 |
-5.3 |
1.5 |
6.561 |
0.000* |
|
|
Female |
-8.36 |
2.18 |
-7.1 |
1.6 |
2.156 |
0.037* |
|
Pogonion' |
Male |
-7.88 |
3.10 |
-2.6 |
1.9 |
6.293 |
0.000* |
|
|
Female |
-5.79 |
3.09 |
-3.5 |
1.8 |
3.044 |
0.004* |
A total of 100 cephalometric variables were analyzed and the results were categorized into four categories, namely, Dentoskeletal factors, Soft tissue structures, Facial lengths and Projection to TVL (Thirty four Parameters) as done in the original Arnett’s soft tissue cephalometric analysis.
Comparison of cephalometric values amongst males & females was also done.
The Nasion-Menton length, upper lip length ,lower lip length, lower 1/3 of face, maxillary height and mandibular height were all greater in males compared to females and differences were statistically significant.
All significant values were greater in males indicating that females have shorter upper and lower lip lengths and smaller faces compared to males.
All antero-posterior measurements to TVL for males and females were statistically similar except the high midface projections to TVL, mandibular soft tissue & incisor projections to TVL in males. The Orbital rim was greater for males (-20.73±2.81) as compared to females(-16.74±2.82). Cheek bone was greater for males (-24.65±3.97)as compared to females (-19.28±3.26,).Subpupil was greater for males(-16.43±6.16) as compared to females (-12.85±2.76). Mandibular Incisor was greater for males (16.25±2.17) as compared to females(-14.00±2.13).
Comparison between soft tissue cephalometric norms of Jaipur population and Arnett’s STCA
Comparison of cephalometric values between soft tissue cephalometric norms of jaipur population and Caucasian population was done in four different categories.
In dentoskeletal factors except for maxillary occlusal plane and overbite there were no statistically significant difference obtained. The maxillary occlusal plane was greater inJaipur sample (99.05+3.55) compared to Caucasian sample (95.6+ 1.8). The overbite was reduced in Jaipur sample (1.94+1.53) compared to Caucasian sample (3.2+0.7).
Soft tissue structures between Jaipur sample and Caucasian sample were compared.
The lower lip thickness was decreased in Jaipur male sample (10.37+1.52) compared to Caucasian sample (13.6+1.4) indicating thin lower lip for Jaipur males sample. Increased chin thickness in the Jaipur male sample as Menton-Menton' for males in Jaipur population was greater (9.28+2.33) compared to Arnett’s sample (7.4+1.6).
Upper lip angle readings in Caucasian sample (12.1+5.1) was greater compared to Jaipur sample (1.14+7.33) indicates Caucasian male sample had protrusive lips compared to Jaipurmale sample.
The total facial height (Nasion'-Menton')and Lower 1/3rd of face was greater in Arnett's sample as compared to Jaipur sample indicating increased facial heights for Arnett’smales.
Lower lip length was decreased for Jaipur males (43.84+3.23) compared to Caucasian males sample (46.9+2.3). This suggests short lower lip for Jaipur males compared to Caucasians.
The TVL projection showed that the Orbital rim (-20.73+2.8 Present study & -18.7+2.0 Arnett STCA) and Cheek bone (-24.65+3.97 Present study and -20.6+2.4 Arnett STCA) values were statistically larger (more negative to TVL) in males of Jaipur sample indicating midface deficiency in Jaipur male sample. Nose was shorter in Jaipur male sample (14.70+1.96) than Caucasian male sample (16.0+1.4).
Dentition in Jaipur sample was found to be retropositioned as compared to Caucasian sample as indicated by the projection values of incisors as the mean Maxillary incisor to TVL for males in Jaipur sample was -12.17+5.16 and -9.2+2.2 in Arnett Sample and Mandibular incisor to TVL for males in jaipur sample was -16.25+2.17 and in Arnett sample was -12.4+2.2.
The Upper lip anterior to TVL was greater in Caucasian sample(3.7+1.2 )compared to Jaipur sample(1.37+1.61) and the mean A-point' to TVL for males in Jaipur sample was -1.84+1.18 and in Caucasian sample was-0.1+1.0. These readings suggests that the upper lip in Caucasian sample was more protrusive compared to Jaipur male sample.
The lower lip anterior to TVL (-2.53+2.20 in Jaipur sample and 1.9+1.4 in Arnett sample), soft tissue B-point to TVL (-9.93+2.68 Jaipur sample and -5.3+1.5 in Arnett sample) and Pogonion' to TVL values (-7.88+3.10 Jaipur sample and -2.6+1.9 in Arnett sample) suggested that lower face is more prominent for the Caucasian males.
Clinical implications
Males have thicker soft tissue structures, especially lower lip thickness. Since the reduction in lip prominence (with the same amount of incisor retraction) is less in individuals with thick lips than those with average lips thickness, difference in male & female lip thickness will have to be considered while planning the amount of incisor retraction for improving esthetics.
The difference in facial heights between men and women might be significant in treatment planning because these differences can be indications to increase or decrease facial height.
The difference in soft tissue parameters in different ethnic groups show the importance of defining what is optimal for a particular group.
Discussion
One of the most important components of orthodontic diagnosis and treatment planning is an evaluation of the patient’s soft tissue profile. The nature of the soft tissue profile is affected by many factors, including ethnicity.
The soft tissue cephalometric values amongst males & females was compared ([Table 1])
In dentoskeletal factors there were no statistical significant difference found between males and females in any of the parameter.
In soft tissue parameters it was observed that the mean value of upper lip thickness for the male group was greater and showed a statistically significant difference when compared to the female group for Jaipur population. The results obtained are smiler to the studies conducted in the various population.[6], [7], [8], [9]
In the facial length parameters males showed a statistically significant difference when compared to female group for Jaipur population which indicates that the females have a shorter upper and lower lip length and smaller faces. The results obtained are in accordance with the studies conducted in the various population.[3], [10]
Comparison of cephalometric values between soft tissue cephalometric norms of jaipur population and Arnett’s population was done ([Table 2])
In dento-skeletal factors maxillary occlusal plane showed statistically significant difference in both male and female samples which indicates that Maxillary occlusal plane was steeper for both. The results obtained are in accordance with other soft tissue cephalometric studies conducted in the various population.[10], [11]
In soft tissue parameters lower lip thickness showed statistically significant difference in both males and females. The lower lip thickness was reduced for Jaipur population as compared to Arnett’s population. Which indicates thin lower lip in Jaipur male and females. The results obtained are in agreement with the study conducted in Maratha ethnic population[11] and contrary to the study conducted in central Indian ethnic population.[10]
The other soft tissue parameters namely Menton-Menton’ and upper lip angle showed a statistically significant difference. The results obtained are supported by the study conducted in Maratha ethnic population.[11]
In Jaipur population as compared to Arnett’s population all facial length parameters had statistically significant except upper lip length. The results obtained are in accordance with study conducted in central Indian ethnic population.[10]
The lower lip length was decreased for Jaipur population as compared to Caucasian population. This suggesting short lower lip for Jaipur population. The results obtained are in accordance with study conducted in central Indian ethnic population[4] and contrary to the study conducted in Maratha population.[11]
In facial length parameters it was observed that the mean Mandibular and maxillary height in Jaipur Sample was reduced as compared to Arnett sample. The results obtained are supported by the studies conducted in other population. [10], [11]
The values for TVL projections parameters namely Glabella, Orbital rim,Cheekbone, SubpupilandAlar base were statistically larger (more negative to TVL) in females of Arnett sample, indicating prominent midface in Jaipur females. These results for TVL projection parameters in accordance with study conducted in central Indian ethnic population12 and contrary to the study conducted in Maratha population. [11]
The projection value for nose was decreased in Jaipur sample as compared to Caucasian sample suggesting more convex faces for Caucasian population are in agreement with the studies conducted in other Indian population. [10], [11]
Conclusion
It is a fact that all different ethnic races have different facial characters. The variability of the soft tissue integument in people with different ethnic origin makes it necessary to study the soft tissue standards of a particular community.
Soft tissue cephalometric values show Sexual dimorphism with all the soft tissue thicknesses and the facial lengths being greater in males indicating longer faces, long upper & lower lips for males and more prominent the midfacial region in Jaipur females compared to males with more protrusive mandibular dentition with a prominent chin.
When Soft tissue cephalometric values of present study compared to Arnett's soft tissue cephalometric analysis (STCA)
The maxillary occlusal plane was steeper for both males and females of Jaipur population as compared to Arnett’s population.
Jaipur males and females have thin short lower lip as compared to Arnett’s population.
Jaipur males and females have greater soft tissue chin thickness as compared to Arnett’s population.
Jaipur population have smaller faces as compared to Arnett’s population.
The Projection values for nose were decreased in Jaipur population indicates short nose and less convex faces compared to Arnett’s population.
Source of Funding
None.
Conflict of Interest
None.
References
- GW Arnett, RT Bergman. Facial keys to orthodontic diagnosis and treatment planning - Part I. Am J Orthod Dentofac Orthop 1993. [Google Scholar]
- GW Arnett, RT Bergman. Facial Keys to orthodontic diagnosis and treatment planning - Part II. Am J Orthod Dentofac Orthop 1993. [Google Scholar]
- GW Arnett, JS Jelic, J Kim, DR Cummings, A Beress, M Worley. Soft tissue cephalometric analysis:Diagnosis and treatment planning of dentofacial deformity. Am J Orthod Dentofac Orthop 1999. [Google Scholar]
- GW Arnett, RP Mclaughlin. Facial and Dental Planning for Orthodontist and Oral Surgeons.. Philadelphia; Mosby 2004. [Google Scholar]
- AS Kalha, A Latif, SN Govardhan. Soft tissue cephalometric norms in a south Indian ethnic population. Am J Orthod Dentofac Orthop 2008. [Google Scholar]
- GW Arnett. Facial planning for orthodontists and oral surgeons. Am J Orthod Dentofac Orthop 2004. [Google Scholar]
- RA Holdaway. A soft-tissue cephalometric analysis and its use in orthodontic treatment planning - Part I. Am J Orthod Dentofac Orthop 1983. [Google Scholar]
- RM Ricketts. The biologic significance of the divine proportions and Fibonacci series. Am J Orthod Dentofac Orthop 1982. [Google Scholar]
- WB Down. Analysis of Dentofacial Profile. Angle Orthod 1956. [Google Scholar]
- S Chhajed. Facial Soft Tissue Cephalometric Norms in a Central Indian Ethnic Population. The J Indian Orthod Soc 2014. [Google Scholar]
- SSingh, Deshmukh. SMean values of Arnett’s soft tissue analysis in Maratha ethnic (Indian) population. J Int Soc Prevent Commun Dent 2016. [Google Scholar]
- Introduction
- Aim and Objectives
- Materials and Methods
- Inclusion criteria
- Exclusion criteria
- As per arnett’s study the findings are discussed under the 4 headings
- Data Management & Statistical Analysis
- Comparison between soft tissue cephalometric norms of Jaipur population and Arnett’s STCA
- Clinical implications
- Discussion
- The soft tissue cephalometric values amongst males & females was compared ([Table 1])
- Comparison of cephalometric values between soft tissue cephalometric norms of jaipur population and Arnett’s population was done ([Table 2])
- Conclusion
- Source of Funding