- Visibility 410 Views
- Downloads 116 Downloads
- DOI 10.18231/j.jco.2023.050
-
CrossMark

Evaluation of horizontal lip position using different soft tissue analysis in Shimla population - A cephalometric study
Introduction
The three main objectives of orthodontic treatment are functional efficiency, structural balance and esthetic harmony.[1] Orthodontists have estimated that 80% of their patients seek treatment out of esthetics concern, rather than for health or function.[2] Shaw et al.[3] showed that a more attractive face is always preferred over a less attractive face, regardless of occlusal characteristics. Formerly the emphasis was on the dental and skeletal components but now the recent shift is more towards the soft tissue paradigm. Our greatest influence on soft tissue is in the area of the lips which has an important part to play in the esthetic and harmony of the face.[4]
Since malocclusion, tooth stability and facial esthetics are influenced in part by the total mass, position in space and general activity of the soft tissue structures, the orthodontist is vitally concerned with soft tissue morphology and posture of lips. Lip posture is a critical element not only for overall facial esthetics but also for post treatment stability and function.[5] Lip thickness, lip tonicity, initial incisor inclination, and lip height will have an impact on the soft tissue changes that occur.[6]
The vermilion aspect of the lips tends to maintain a close postural relationship to their supporting tissues and there is a strong interrelationship between the lips and dental structures. The anteroposterior position of the vermilion region of the lips is closely related to the underlying structures - the teeth and the alveolar process. For a long time, orthodontists have focused on horizontal lip position as the most important factor in determining beauty.[7]
Several authors including Steiner,[8] Ricketts,[9] Burstone,[5] Sushner, [10] Holdaway [11] and Merrifield have described analyses using different lines and planes to assess the anteroposterior position of the upper and lower lip in relation to an esthetic facial profile. In various studies cephalometric norms for different ethnic and racial groups have been established and all these studies indicated that normal measurement for one group should not be considered normal for every race or ethnic group. Different racial groups must be treated according to their own characteristics. Therefore, the purpose of this study is to evaluate the horizontal lip position using different soft tissue analysis in Shimla adult population.
Materials and Methods
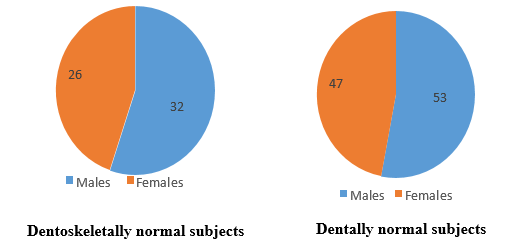
This study was conducted in the Department of Orthodontics and Dentofacial Orthopaedics, Government Dental College & Hospital, Shimla, Himachal Pradesh (H. P), after the study protocol was approved by the Institutional Review Board (HFW(GDC)B(12)50/2015 3359). The sample comprised of pre-treatment lateral cephalograms of 100 subjects aged 18-25 years. The total number of subjects having Angle’s Class I molar, Class I canine relationship were called as dentally normal subjects while those subjects having Angle’s Class I molar, Class I canine relationship and ANB, SN-MP angles also within the normal range were called as Dentoskeletally normal subjects (Pie [Figure 1]).
Standardized digital lateral cephalograms were taken with the digital cephalometric machine Carestream CS8100SC with the patient standing in the Natural Head Position with the eyes straight ahead, the teeth in centric occlusion and the lips in slight contact. Standardized 8” ×10” dry view laser imaging film was used for each subject. The cephalograms were taken with a voltage 80 Kvp, current 10 mA and exposure time of 10 seconds. The same operator took all the radiographs. All lateral cephalograms were then transferred to a computer with CS 8100SC imaging software and then hard copies were printed with the help of an X-ray printer (Dry view 5700 laser image).
Inclusion criteria
Angle’s Class I molar and Class I canine relationship with mild crowding (1-3mm).
Subjects whose parents and grandparents from Himachal Pradesh.
Age group (18-25 years).
Presence of all permanent teeth, 3rd molars not taken into consideration.
Normal overjet and overbite.
Symmetrical face.
Dentally normal subjects with Angle’s Class I molar, Class I canine relationship
Dentoskeletally normal subjects with Angle’s Class I molar, Class I canine relationship and ANB (2±2ᵒ), SN-MP (32±5ᵒ) angles within normal range.
Exclusion criteria
History of previous orthodontic or functional jaw orthopaedic treatment and prosthodontics treatment.
History of any surgery involving jaw, cleft lip and palate and any systemic disease affecting normal growth.
History of trauma to the dentofacial structure.
Parameters Used in the Study
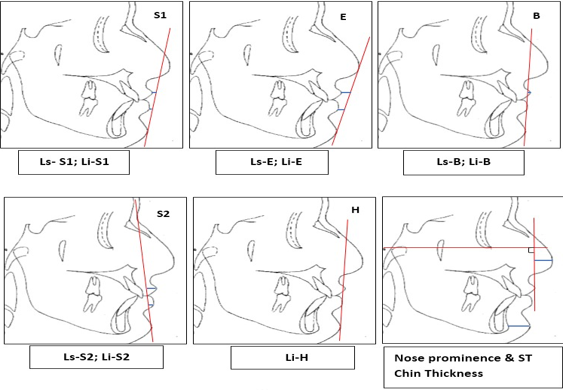
Linear parameters ([Figure 2])
Ls-S1 Line - The distance from the most anterior point of the upper lip to the Steiner’s S1 line.
Li-S1 Line - The distance from the most anterior point of the lower lip to the Steiner’s S1 line.
Ls-E Line - The distance from the most anterior point of the upper lip to the Rickett’s E line.
Li-E Line - The distance from the most anterior point of the lower lip to the Rickett’s E line.
Ls-B Line- The distance from the most anterior point of the upper lip to the Burstone’s B line.
Li-B Line- The distance from the most anterior point of the lower lip to the Burstone’s B line.
Ls-S2 Line - The distance from the most anterior point of the upper lip to the Sushner’s S2 Line.
Li-S2 Line - The distance from the most anterior point of the lower lip to the Sushner’s S2 line.
Li-H Line - The distance from the most anterior point of the lower lip to the Holdaway’s H line.
Nose prominence- The distance from the most prominent or anterior point of the nose (tip of the nose) to a line perpendicular to Frankfort horizontal and running tangent to the vermilion border of the upper lip.
Soft tissue chin thickness- The distance between two vertical lines representing the hard-tissue and soft-tissue facial planes at the level of Ricketts’ suprapogonion.
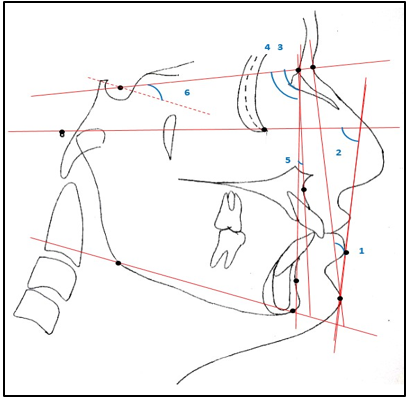
Angular parameters ([Figure 3])
H- Angle - Angle between the H-line and soft tissue Na-Pog line.
Z- Angle- Angle made by the Merrifield’s profile line with the Frankfort horizontal line.
SNA Angle - Angle between Sella, Nasion and Point A.
SNB Angle - Angle between Sella, Nasion and Point B.
ANB Angle - Angle between Point A, Nasion and Point B.
SN- MP Angle - Angle between Sella-Nasion line and mandibular plane (Go-Gn).
Statistical analysis
Standard descriptive statistics (mean and standard deviation) were calculated for the present sample. The comparison between males and females in dentally normal and Dentoskeletally normal subjects were performed using student’s t-test. The horizontal lip position of Dentoskeletally normal subjects of Shimla adult population was compared with established norms using student’s t-test. The Levene’s variance homogeneity test was applied to the data, which was found to be normally distributed. The coefficient of variation of different reference lines with respect to upper and lower lip was calculated from total number of subjects.
Results
Statistically none of the parameters showed significant difference in horizontal lip position of Dentoskeletally and dentally normal subjects ([Table 1]). In dentally normal subjects, the upper and lower lip showed statistically significant difference in males and females. With respect to E-line the lower lip only showed statistically significant difference in males and females ([Table 2]). In dentoskeletally normal subjects the upper lip with respect to S-line and B-line showed statistically significant difference in males and females. ([Table 3]). The Dentoskeletally normal subjects of Shimla adult population showed statistically highly significant difference for upper and lower lip position with respect to S-line and B-line ([Table 4]).
|
S. No. |
Parameters |
Dentally normal subjects (n=100) |
Dentoskeletally normal subjects (n=58) |
Significance |
|||
|
Mean |
SD |
Mean |
SD |
Mean diff |
P-value |
||
|
1 |
Ls-S1 (mm) |
-3.03 |
1.817 |
-3.45 |
1.749 |
-.418 |
.159 NS |
|
2 |
Li-S1 (mm) |
-1.10 |
2.003 |
-1.52 |
1.779 |
-.417 |
.191 NS |
|
3 |
Ls-E (mm) |
-4.50 |
2.209 |
-4.84 |
2.159 |
-.345 |
.342 NS |
|
4 |
Li-E (mm) |
-1.89 |
2.020 |
-2.28 |
1.745 |
-.386 |
.226 NS |
|
5 |
Ls-B (mm) |
2.46 |
1.534 |
2.02 |
1.207 |
-.443 |
.061 NS |
|
6 |
Li-B (mm) |
1.94 |
1.774 |
1.57 |
1.523 |
-.371 |
.185 NS |
|
7 |
Ls-S2 (mm) |
9.60 |
2.197 |
9.34 |
1.860 |
-.255 |
.458 NS |
|
8 |
Li-S2 (mm) |
5.58 |
2.161 |
5.29 |
1.901 |
-.287 |
.402 NS |
|
9 |
Li-H (mm) |
.60 |
1.414 |
.48 |
1.354 |
-.117 |
.611 NS |
|
10 |
Nose prominence (mm) |
13.48 |
2.911 |
13.98 |
3.086 |
.503 |
.308 NS |
|
11 |
ST Chin thickness (mm) |
11.20 |
1.787 |
11.21 |
1.852 |
.007 |
.982 NS |
|
12 |
H-angle (ᵒ) |
14.24 |
3.493 |
13.62 |
2.484 |
-.619 |
.237 NS |
|
13 |
Z-Angle (ᵒ) |
74.09 |
5.993 |
75.31 |
4.430 |
1.220 |
.179 NS |
|
S. No. |
Parameters |
Males (n=53) |
Females (n=47) |
Significance |
|||
|
Mean |
SD |
Mean |
SD |
Mean Diff |
p-value |
||
|
1 |
Ls-S1 (mm) |
-3.57 |
1.814 |
-2.43 |
1.638 |
-1.141 |
0.001** |
|
2 |
Li-S1 (mm) |
-1.57 |
2.333 |
-.57 |
1.395 |
-.992 |
0.013* |
|
3 |
Ls-E (mm) |
-4.74 |
2.610 |
-4.23 |
1.631 |
-.502 |
0.259 NS |
|
4 |
Li-E (mm) |
-2.30 |
2.325 |
-1.43 |
1.500 |
-.876 |
0.030* |
|
5 |
Ls-B (mm) |
2.72 |
1.228 |
2.23 |
1.739 |
-.497 |
0.106 NS |
|
6 |
Li-B (mm) |
1.70 |
2.025 |
2.21 |
1.413 |
-.515 |
0.149 NS |
|
7 |
Ls-S2 (mm) |
9.75 |
2.278 |
9.43 |
2.114 |
.329 |
0.457 NS |
|
8 |
Li-S2 (mm) |
5.68 |
2.360 |
5.47 |
1.932 |
.211 |
0.628 NS |
|
9 |
Li-H (mm) |
.49 |
1.577 |
.72 |
1.210 |
-.233 |
0.414 NS |
|
10 |
Nose-prominence (mm) |
14.83 |
2.772 |
11.96 |
2.255 |
2.873 |
0.000*** |
|
11 |
ST Chin thickness (mm) |
11.57 |
1.814 |
10.79 |
1.680 |
.779 |
0.029* |
|
12 |
H-angle (ᵒ) |
14.04 |
3.721 |
14.47 |
3.243 |
-.430 |
0.541 NS |
|
13 |
Z-Angle (ᵒ) |
73.70 |
6.329 |
74.53 |
5.625 |
-.834 |
0.490 NS |
|
S. No. |
Parameters |
Males (n=32) |
Females (n=26) |
Significance |
|||
|
Mean |
SD |
Mean |
SD |
Mean Diff |
p-value |
||
|
1 |
Ls-S1 (mm) |
-4.00 |
1.459 |
-2.77 |
1.861 |
-1.231 |
.007** |
|
2 |
Li-S1 (mm) |
-1.91 |
2.100 |
-1.04 |
1.148 |
-.868 |
.064 NS |
|
3 |
Ls-E (mm) |
-5.00 |
2.527 |
-4.65 |
1.623 |
-.346 |
.548 NS |
|
4 |
Li-E (mm) |
-2.56 |
2.031 |
-1.92 |
1.262 |
-.639 |
.167 NS |
|
5 |
Ls-B (mm) |
2.38 |
1.061 |
1.72 |
1.250 |
-.666 |
.035* |
|
6 |
Li-B (mm) |
1.77 |
1.032 |
1.41 |
1.892 |
-.363 |
.371 NS |
|
7 |
Ls-S2 (mm) |
9.63 |
1.641 |
9.00 |
2.078 |
.625 |
.206 NS |
|
8 |
Li-S2 (mm) |
5.56 |
2.109 |
4.96 |
1.587 |
.601 |
.234 NS |
|
9 |
Li-H (mm) |
.47 |
1.545 |
.50 |
1.105 |
-.031 |
.931 NS |
|
10 |
Noseprominence (mm) |
15.38 |
3.066 |
12.27 |
2.127 |
3.106 |
.000*** |
|
11 |
ST Chin thickness (mm) |
11.63 |
1.809 |
10.69 |
1.806 |
.933 |
.056 NS |
|
12 |
H-angle (ᵒ) |
13.72 |
2.413 |
13.50 |
2.612 |
.219 |
.744 NS |
|
13 |
Z-Angle (ᵒ) |
74.22 |
4.397 |
76.65 |
4.166 |
-2.435 |
.036* |
|
S. No. |
Parameters |
Dentoskeletally normal subjects (n=58) |
Established norms |
Significance |
||
|
Mean |
SD |
Mean/Rang e |
SD |
p-value |
||
|
1 |
Ls-S1 (mm) |
-3.45 |
1.749 |
0.00 |
0.00 |
<0.001*** |
|
2 |
Li-S1 (mm) |
-1.52 |
1.779 |
0.00 |
0.00 |
<0.001*** |
|
3 |
Ls-E (mm) |
-4.84 |
2.159 |
-4.00 |
0.00 |
<0.001*** |
|
4 |
Li-E (mm) |
-2.28 |
1.745 |
-2.00 |
0.00 |
<0.001*** |
|
5 |
Ls-B (mm) |
2.02 |
1.207 |
3.50 |
1.40 |
0.328 NS |
|
6 |
Li-B (mm) |
1.57 |
1.523 |
2.20 |
1.60 |
0.731 NS |
|
7 |
Ls-S2 (mm) |
9.34 |
1.860 |
9.05 |
2.18 |
0.397 NS |
|
8 |
Li-S2 (mm) |
5.29 |
1.901 |
7.25 |
2.04 |
0.001*** |
|
9 |
Li-H (mm) |
0.48 |
1.354 |
0.5 |
1.5 |
0.441 NS |
|
10 |
Nose-prominence (mm) |
13.98 |
3.086 |
19 |
5 |
<0.005** |
|
11 |
ST Chin thickness (mm) |
11.21 |
1.852 |
10-12 |
-- |
NA |
|
12 |
H-angle (ᵒ) |
13.62 |
2.484 |
7-15 |
-- |
NA |
|
13 |
Z-Angle (ᵒ) |
75.31 |
4.430 |
80 |
5 |
<0.001*** |
Discussion
Steiner's S1-Line
The upper lip (Ls-S1) and the lower lip (Li-S1) is significantly protrusive in females compared to males in Dentally normal subjects (p=0.013). The measured value in Dentoskeletally normal subjects also indicates protrusive lower lip in females compared to males but statistically it is not significant (p=0.064). Similarly, both upper and lower lip in relation to Steiner’s S1-line were protrusive in females compared to males in a study done by Pandey et al. and Umale et al. [12] Erbay et al.[7] also reported in their study that both upper and lower lip were more protrusive in females as compared to males in “dentally and skeletally normal” group. The protrusive upper and lower lips in females in Shimla population can be explained by the fact that nose prominence is significantly less in females as compared to males in present study (p=0.000). The other reason for protrusive lips in females in Shimla population may be because of less soft tissue chin thickness compared to males.
Ricketts’ E-Line
The measured value for upper lip (Ls-E) and lower lip (Li-E) showed protrusive upper and lower lip in females compared to males in Dentally as well as Dentoskeletally normal subjects but statistically it is not significant (p>0.05). This means that the upper and lower lip protrusion in females of Shimla adult population in relation to Rickett’s E-line is esthetically acceptable. Cheng FG[13] also found that in relation to Rickett’s plane Chinese females had more protrusive lower lip. Umale et al. [12] and Kalgotra et al. [14] also found protrusive lips in relation to E-line in females compared to males in their study. In comparison to Ricketts’ norms Dentoskeletally normal subjects of Shimla adult population has retrusive upper (Ls-E) and lower lip (Li-E) which is statistically very highly significant (p<0.001). This means that the retruded lip position is esthetically acceptable in Shimla adult population. The retrusive lip profile in Dentoskeletally normal subjects of Shimla adult population could be attributed to the retruded maxilla and mandible in Shimla adult population. This is in accordance with the study of Singh et al.[13] in which they concluded that both maxilla and mandible were retruded in North Indian population.
Burstone's B Line
The upper lip (Ls-B) and lower lip (Li-B) showed statistically no significant difference between males and females in Dentally normal subjects in our study (p>0.05). In the Dentoskeletally normal subjects the upper lip (Ls-B) is significantly more protrusive in males compared to females, while lower lip (Li-B) showed no statistically significant difference in males and females. This is in accordance with the study done by Jain and Kalra [15] in North Indian population, Celebi et al.[16] and Uysal et al. [17] on Turkish adults in which they also found significantly more protrusive upper lip in males compared to females.
Sushner's S2 Line
There is no statistically significant difference for upper (Ls-S2) and lower lip (Li-S2) in Dentally as well as Dentoskeletally normal subjects in our study. Erbay et al.[7] also reported no statistically significant difference for upper and lower lip in dentally normal group as well as dentally and skeletally normal group. Umale et al. [12] in their study also found no statistically significant difference in males and females in relation to Sushner’s S2 line. The measured values for upper and lower lips in males of Shimla adult population is more compared to females can be attributed to the fact that the upper and lower lip thickness is more in males compared to females. The upper lip (Ls-S2) of Dentoskeletally normal subjects in ths study is slightly more protrusive than the norms given by Sushner although it is not statistically significant.
Holdaway's H Line
The lower lip (Li-H) in relation to Holdaway’s H-line shows statistically no significant difference between males and females neither in Dentally normal subjects nor in Dentoskeletally normal subjects of Shimla adult population. Although the measured value for lower lip (Li-H) is more in females compared to males in Dentally as well as Dentoskeletally normal subjects of Shimla adult population. Similar findings were reported by Basciftci et al. [18] on Anatolian Turkish adults and Sachan et al. [19] in North Indian ethnic population. Pandey et al. also found no significant difference in males and females in relation to Holdaway’s H-line.
Nose Prominence and Soft Tissue Chin Thickness
In this study males have significantly more nose prominence than females in both Dentally and Dentoskeletally normal subjects. This is in accordance with the findings of Sachan A et al.[19] Females had significantly less soft tissue chin thickness compared to males in Dentally normal group. This is inagreement with the study of Kalogtra S [14] in Kashmiri population, Gupta A et al. [20] in North Indian population, Nanda and Ghosh [21] on young adult white men and women, and Sachan et al. [19] in North Indian ethnic population. The mean value obtained for nose prominence in this study is 13.98mm which means that the Shimla adult population has small nose prominence. The soft tissue chin thickness in Dentoskeletally normal subjects of Shimla adult population found within the normal range (11.21±1.852mm) as given by Holdaway (10-12mm).
H-Angle
In present study statistically, no significant difference was found for H-angle between males and females in Dentally as well as Dentoskeletally normal subjects. The H-Angle value of Dentoskeletally normal subjects of Shimla adult population is within the normal range given by Holdaway. The best range given for H angle was 7-15 degrees which varies with skeletal convexity of case.
Z-Angle
The Z-angle value in Dentoskeletally normal subjects is significantly more in females compared to males (p=0.036). The measured value of Z-angle in Dentally normal subjects is also more in females compared to males, although it is not statistically significant (p=0.490). Similarly measured value of Z-angle in females in dentally normal group as well as dentally and skeletally normal group was reported more in males as compared to females by Erbay et al. [7] in their study on Anatolian Turkish adults.
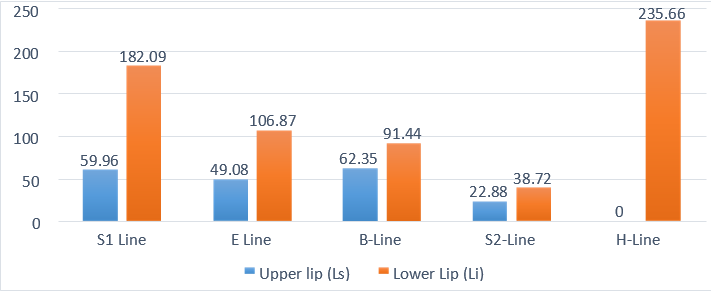
Coefficient of variation: (Graph 1)
The smaller coefficient of variation the better the consistency of the reference lines. In this study the coefficient of variation was calculated for five analytic reference lines with respect to upper and lower lip. It was found that S2 line had the least coefficient of variation (upper lip: 22.88% and lower lip: 38.72%) and provided the narrowest dispersion for both the lips. Hence, it can be considered to be the best reference line in terms of judging the horizontal position of the lips in profile analysis. The reason for S2 line being the most consistent line may be because it passes through stable anatomic landmark nasion compared to nose. Therefore, S2 line should be kept in mind while analysing the soft tissue profile because of its stable and consistent position.
Conclusion
Following conclusions were derived from this study:
Upper lip position in relation to Steiner’s S1 line and lower lip position in relation to Steiner’s S1 line and Ricketts’ E line showed statistically significant difference between genders in Dentally normal group with females having protrusive lips.
Upper lip position in relation to Steiner’s S1 line and Burstone’s B line showed statistically significant difference between genders in Dentoskeletally normal group with protrusive upper lip in females in relation to Steiner’s S1 line and protrusive upper lip in males in relation to Burstone’s B line.
Statistically no significant difference was found between Dentally normal and Dentoskeletally normal subjects showing soft tissue compensation for skeletal relationship.
In Shimla adult population retrusive upper lip in relation to Steiner’s S1 line, Ricketts’ E line and retrusive lower lip in relation to Steiner’s S1 line, Ricketts’ E line, Sushner’s S2 line was found. The norms for upper and lower lip position in relation to Burstone’s B line in Shimla adult population coincide with the established Burstone’s norms. Holdaway’s established norms for lower lip can also be applied to Shimla adult population.
Sushner’s S2 line showed the least coefficient of variation for upper and lower lip, hence maximum consistency among various reference lines. Therefore, it should be line of choice to judge the horizontal lip position in profile analysis.
Thus, Shimla adult population has different cephalometric norms for horizontal lip position in relation to Steiner’s and Ricketts’ lines, whereas same established norms of Burstone and Holdaway can be applied to Shimla adult population.
Source of Funding
None.
Conflict of Interest
None.
References
- AF Jackson. Orthodontic perspective. Am J Orthod 1956. [Google Scholar]
- JE Albino, JJ Cunat, RN Fox, EA Lewis, MJ Slakter, LA Tedesco. Variables discriminating individuals who seek orthodontic treatment. J Dent Res 1981. [Google Scholar]
- WC Shaw, G Rees, M Dawe, CR Charles. The influence of dentofacial appearance on the social attractiveness of young adults. Am J Orthod 1985. [Google Scholar]
- RS Hamelton. The soft tissue covering of the skeletal face as related to orthodontic problems. Am J Orthod 1964. [Google Scholar]
- CJ Burstone. Lip posture and its significance in treatment planning. Am J Orthodontics 1967. [Google Scholar]
- II Brock, RG Behrents, RW Taylor, PH Buschang. Ethnic differences in upper lip response to incisor retraction. Am J Orthod Dentofac Orthop 2005. [Google Scholar]
- EF Erbay, CM Caniklioğlu, SK Erbay. Soft tissue profile in Anatolian Turkish adults: Part I. Evaluation of horizontal lip position using different soft tissue analyses. Am J Orthod Dentofac Orthop 2002. [Google Scholar]
- CC Steiner. The use of cephalometrics as an aid to planning and assessing orthodontic treatment. Am J Orthod 1960. [Google Scholar]
- RM Ricketts. Planning treatment on the basis of the facial pattern and an estimate of its growth. Am J Orthod 1957. [Google Scholar]
- NI Sushner. A photographic study of the soft tissue-profile of the Negro population. Am J Orthod 1977. [Google Scholar]
- RA Holdaway. A soft-tissue cephalometric analysis and its use in orthodontic treatment planning. Part I. Am J Orthod 1983. [Google Scholar]
- S Pandey, S Kapoor, S Agarwal, I Shukla. Evaluation of Lip Position in Esthetically Pleasing Profiles Using Different Reference Lines: A Photographic Study. J of Indian Orthod Soc 2021. [Google Scholar]
- S Kalgotra, M Mushtaq, A Khajuria. Soft tissue cephalometric norms of Kashmiri population with Normal occlusion and well-balanced Faces. J Ind Orthod Soc 2020. [Google Scholar]
- FG Cheng. A cephalometric study of the Chinese in profile. Aust Orthod J 1986. [Google Scholar]
- SP Singh, AK Utreja, AK Jena. Cephalometric norms for orthognathic surgery for North Indian population. Contem Clin Dent 2013. [Google Scholar]
- P Jain, JPS Kalra. Soft tissue cephalometric norms for a North Indian population group using Legan and Burstone analysis. Int J Oral Maxillofac Surg 2010. [Google Scholar]
- AA Celebi, E Tan, IE Gelgor, T Colak, E Ayyildiz. Comparison of soft tissue cephalometric norms between Turkish and European-American Adults. The Scient World J 2013. [Google Scholar] [Crossref]
- T Uysal, A Baysal, A Yagci, LM Sigler, JA Mcnamara. Ethnic differences in the soft tissue profiles of Turkish and European-American young adults with normal occlusions and well-balanced faces. Eur Journ of Orthod 2012. [Google Scholar]
- FA Basciftci, T Uysal, A Buyukerkmen. Craniofacial structure of Anatolian Turkish adults with normal occlusions and well-balanced faces. Am J Orthod Dentofac Orthop 2004. [Google Scholar]
- FA Basciftci, T Uysal, A Buyukerkmen. Craniofacial structure of Anatolian Turkish adults with normal occlusions and well-balanced faces. Am J Orthod Dentofac Orthop 2004. [Google Scholar]
- A Gupta, J Garg, N Anand, M Hegde, S Prashar. Establishment of soft tissue norms for the north Indian population based on laymen perception. J Maxillofac Oral Surg 2014. [Google Scholar]