- Visibility 73 Views
- Downloads 7 Downloads
- DOI 10.18231/j.jco.2024.032
-
CrossMark

Evaluation of the correlation of mandibular ramus to base ratio with mandibular incisor angulation: A cephalometric study
- Author Details:
-
 Vivek Kumar Thakur
-
Dinesh Chander Chaudhary *
Introduction
Lateral cephalogram and cephalometric measurements form an integral part of orthodontic diagnosis and treatment planning. The cephalometric evaluation is based on composite norms available through various studies on different populations and varied sample sizes.[1], [2], [3] The judicious contemporary method is to use floating norms as suggested by Athenosiou.[4] However, specific racial and ethnic differences need to be taken into account while considering the normal values of a specific cephalometric parameter.[5] Normal skeletal and dental cephalometric parameters along with associated compensations are also counterparts.[6], [7] The knowledge of these existing compensations as regional normative standards may enable the orthodontist to formulate a more population-specific treatment plan. Various studies have given Indian norms for Incisor Mandibular Plane Angle (IMPA) that are significantly more than Caucasian norms.[8], [9], [10] However, there is a vacuum in literature, correlating the mandibular incisors anteroposterior position with mandibular proportions and whether the change in their position has any correlation with mandibular ramus to base proportion. To find answers to these questions, this study was designed with a null hypothesis that there is no correlation of mandibular ramus (Co-Go) to the base (Go-Pog) ratio with incisor proclination in a mixed Indian population.
Inclusion criteria
Pretreatment records of subjects with skeletal Class I malocclusion (ANB: 1-3 degrees and Witts +1to -1)
Availability of diagnostic quality lateral cephalograms
No spacing in the upper or lower anterior teeth
Saddle angle (N-S-Ar in the normal range (123±5)˚
Average growth pattern
Exclusion criteria
Previous orthodontic treatment
Patients with cleft lip and palate or syndromic conditions
Patients in mixed dentition
Materials and Methods
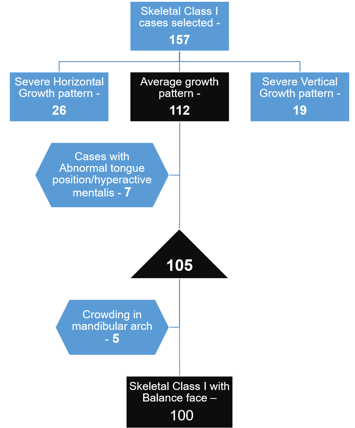
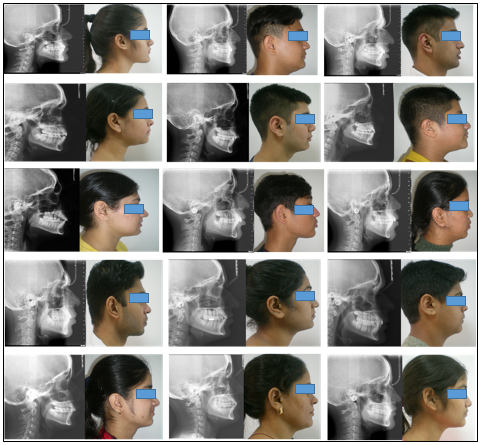
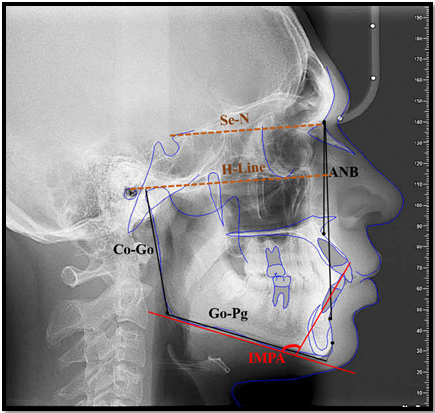
The study was carried out in a tertiary care dental hospital with orthodontic facility and available data bank of a mixed Indian population.[11] Sample size calculation was based on previous studies, using a two-sided test, a 5% significance level test (α=0.05) with power 80% (β=0.2) and the required sample size was approximately 60 (n=60). However, A total of 100 cephalograms were selected from the archives of the department of orthodontics fulfilling inclusion & exclusion criteria. [[Figure 1], [Figure 2]] The mean age of cases studied was 17.09 ± 2.61 years with an age range of 13 – 26 years. The selected cephalograms were traced manually by the first author. The parameters used for comparisons are shown in the representative image. [[Figure 3]]
The statistical evaluation of means of normally distributed continuous variables with the reference standard is done using a one-sample t-test. Correlation analysis was done using Pearson’s correlation method. Linear regression analysis was performed to predict the value of the dependent variable based on the independent variable on obtaining a statistically significant correlation. The underlying normality assumption was tested before subjecting the study variables to Pearson’s correlation analysis and regression analysis. The statistical analysis was carried out using Statistical Package for Social Sciences (SPSS ver 24.0, IBM Corporation, USA) for MS Windows.
|
Variables |
Mean |
SD |
Reference value |
P-value |
|
Incisor mandibular plane angle (IMPA) |
101.59 |
6.71 |
90.00 |
0.001*** |
|
Ratio of Ramus to Mandibular Base |
0.80008 |
0.0543 |
0.71428 (1/1.4) |
0.001*** |
|
P-value by one-sample t test. P-value<0.05 is considered to be statistically significant. ***P-value<0.001. |
|
|
Correlate between IMPA with Ratio of Ramus to Mandibular Base |
||
|
Group |
No. of subjects |
r-value |
P-value |
|
Male |
47 |
0.519 |
0.001*** |
|
Female |
53 |
0.496 |
0.001*** |
|
All |
100 |
0.508 |
0.001*** |
|
Correlation analysis by Pearson’s method. P-value<0.05 is considered to be statistically significant. ***P-value<0.001. |
|
|
Regression analysis for the prediction of Ratio of Ramus to Mandibular Base using IMPA |
|||
|
Group |
No. of subjects |
Regression Equation |
P-value |
%R2 |
|
Male |
47 |
Ratio = 0.364 + 0.004 x IMPA |
0.001*** |
27.0% |
|
Female |
53 |
Ratio = 0.400 + 0.004 x IMPA |
0.001*** |
24.6% |
|
All |
100 |
Ratio = 0.382 + 0.004 x IMPA |
0.001*** |
25.8% |
|
Dependent Variable: Ratio, Independent Variable : IMPA, ***P-value<0.001. |
Results
Comparison of IMPA and the ratio of ramus to the mandibular base with the reference standards. [[Table 1]]
The mean IMPA in the study population was significantly higher 102 ± 6.71 degrees, compared to the reference standard value of 90 degrees (P-value<0.05). [1] The mean ratio of ramus to mandibular base in the study population is significantly higher 0.8 compared to the reference standard value [12] of 0.7 (P-value<0.05).
Correlation analysis of IMPA with the ratio of ramus to the mandibular base. [[Table 2]]
On Pearson’s correlation analysis, the IMPA showed a statistically significant positive correlation with the ratio of ramus to mandibular base in the study group (p value<0.05). The higher IMPA was significantly associated with a higher ratio of ramus to mandibular base in both male and female groups.
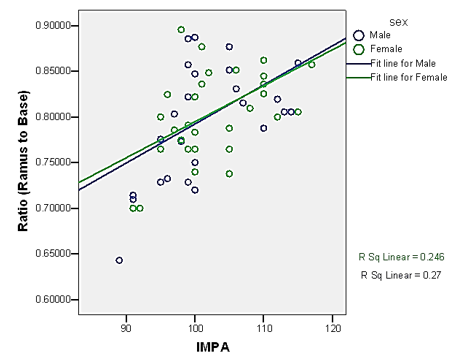
The gender-specific linear regression analysis for the prediction of the ratio of ramus to the mandibular base using IMPA. [[Table 3]] [[Figure 4]]
Simple linear regression analysis was used to test if IMPA significantly predicted the ratio of ramus to mandibular base. Based on regression analysis it was concluded that the unit increase in IMPA is significantly associated with 0.004 units increase in the ratio of ramus to mandibular base in both the genders.
Discussion
Achieving balanced facial proportions and stable orthodontic treatment results always remain one of the important treatment objectives during the orthodontic diagnosis and treatment planning phase. The importance of mandibular ramus and mandibular body size in determining the proportionate facial dimensions along with compensatory cephalometric angles such as saddle angle, articular angle, gonial angle, and the basal plane angle is historically well known and documented in cephalometric literature.[4], [12], [13] Incisor mandibular plane angle is often associated with treatment stability.[14], [15], [16], [17] However, the correlation between these two cephalometric parameters (mandibular body length & IMPA) has not been studied in detail.
It is a known fact that racial differences lead to specific normative standards for a specific population, studies confirm the variability and also increased IMPA values for the Indian population. [8], [9] Also reduced mandibular body size when compared with mandibular ramus length in the Indian population, resulting in an increased value of mandibular ramus to body ratio. In our study, the mean IMPA of the population was 102 ± 6.71 degrees and this corroborates with the study of Garg and co-worker [9] on the north Indian population with well balanced faces and Class I occlusion. Their study found IMPA for males as 102 ± 7˚ and for females as 99 ± 7˚. But, a similar study by Singh SP and co-workers found IMPA in the north Indian population to be 92.21⁰± 10.31 in males and 97.41⁰± 10.61 in females. The standard deviation was significantly higher in the study by Singh & co-workers. [8] Thus, there is a significant variation in average IMPA values, especially in males, in the findings of the two studies. This may be attributed to the different age groups of populations evaluated; being 18-25 years in one and 14-24 years in the second group respectively. The study by Tripti et al [18] in another north Indian population sample of 100 patients in the age group 18-25 years with a mean age of 21±2.62 years found that IMPA values for females were higher; 101.49⁰±7.94⁰ compared to males 99.99⁰±7.30⁰. Sahoo et al. [19] in a similar study on the East Indian population in the age group 18-30 years found IMPA in males to be 98.8⁰±14.9⁰ and 102.3⁰±9.1⁰. All these studies have been carried out in similar population groups with similar age and gender subgroups. All these studies prove that IMPA values in the Indian population are significantly increased compared to established norms and considering the high standard deviation there is a significant individual variation in the angulation of mandibular incisors. Though the subjects in these studies have a well-balanced facial proportion and Class I occlusion the reason for these large variations remains unexplained.
Various other studies made attempts to correlate mandibular incisor angulation with gonial angle, mandibular symphysis characteristics and skeletal patterns. Guterman et al. [20] in a sample from Zurich Craniofacial longitudinal growth study in 6-18 years old, studied the correlations between the angulation of the lower incisors with age, symphyseal measurements (height, width, and depth), symphyseal ratios (height-width, height-depth), and skeletal angles (divergence of the jaws and gonial angle) for all ages separately and both genders independently. They found that inclination of lower incisors changed over age; 8 years: girls 93.9⁰ (92.3⁰–95.7⁰), boys 93.3⁰ (91.8⁰–94.9⁰) to 16 years: girls 96.1⁰ (94.1⁰–98.2⁰), boys 97.1⁰ (95.6⁰–98.6⁰). They concluded that symphyseal dimensions have a limited effect on lower incisor angulation but are linked to the subject’s gender, age and skeletal vertical pattern.
Rakosi [12] found that angulation of lower incisors with mandibular plane changes with age. He concluded that this angle increased from 88⁰ to 94⁰ from the 6th to 12th year of age with the mean value of 90⁰± 3⁰. They have compiled the comparative linear measurements of the mandiblular body and ramus but have not correlated any of these with the angulation of lower incisors.
Nazir & Mushtaq [21] studied the correlation of incisor mandibular plane angle (IMPA), Frankfort mandibular plane angle (FMA) and lower incisor to A-Pog distance and their relation in different skeletal classes. They concluded that there appears to exist a demonstrable relationship between the axial inclination of the mandibular incisors and the incisor mandibular plane angle and a relationship between the incisor mandibular plane angle and the contour of the lower third of the face; the lower incisors being more upright in subgroups with prognathic mandible than subgroups with the normal or retrognathic mandible. But, in their study, the mean IMPA in Class I, II and III subjects with similar Frankfurt-Mandibular plane angle (FMA) was 91.35⁰ (SD-6.49⁰), 93.75⁰ (SD-6.62⁰) and 81.60⁰ (SD-10.05⁰) respectively. Although this study proposes the role of the contour of the lower third of the face in IMPA, but considering similar FMA angles the influence seems limited as the average difference in IMPA is only 2.45⁰ in patients of Class I & Class II. The study would have been more informative if different FMA subgroups would have been considered in Class I, II & III malocclusions and then correlated with IMPA.
It’s been a common observation that skeletal Class II cases present with increased IMPA and Class III cases with decreased IMPA as an attempt to compensate for the decreased and increased mandibular length respectively to maintain function, but the degree of variation is always variable. There is no available literature quantifying the increase or decrease in IMPA with the change in the unit length of the mandible. Besides, the lip and tongue musculature may have a profound and variable effect on the mandibular incisor angulation, depending on their activity. Lip trap in Class II div 1 malocclusion may prevent the increase in mandibular incisor angulation or altered tongue pressure due to reduced space as seen in the retrognathic mandible may significantly increase their angulation. Thus, to study the adaptation of mandibular incisor angulation to mandibular base, the sample of Class I malocclusion cases with balanced facial proportions was the apt choice.
Thus, to find the unanswered questions this study took into consideration the ratio of mandibular ramus to body and its correlation with the angulation of mandibular incisors. Although age dependent norms are available for different populations yet considering the diversity, not many people will have similar facial dimensions even in well balanced faces and this variability finds its expression in the angulation of mandibular incisors as well. In our study, the IMPA showed a positive correlation with the ratio of ramus to mandibular base. The higher incisor mandibular plane angle was significantly associated with a higher ratio of ramus to mandibular base in both male and female groups. The statistical finding shows that the unit increase in IMPA is associated with a 0.004 unit increase in the ratio of ramus to mandibular base. On extrapolating these findings to the clinical relevance, every 10 degrees increase of IMPA might be related to approximately 4 mm deficiency in the mandibular body length compared with the ramus length of that particular case or vice-versa every 5mm mandibular deficiency will increase IMPA by 2⁰. In our study, the ramus to mandibular base ratio was found to be 0.8 against the norm of 0.7. Now let us consider one example; if the ramus length is 55 mm then the corresponding body length should be 78 mm for a ratio of 0.7. For a ratio of 0.8, the corresponding body length is only 65 mm. Thus, for a change in the ratio of 0.1, the change in mandibular body length is approximately 13 mm. Thus, even a slight change in the ratio of ramus to body can have a significant impact on the anteroposterior positioning of the dentition. Thus, in an average grower, this change can produce an average change of about 12 degrees of IMPA, as reflected in our study results with mean IMPA 102⁰ ± 6.85⁰.
The only limitation of this study was the limited sample size. The strength of this study is that the results of this study show a strong correlation between a ratio value of two mandibular dimensions (ramal length and basal length) with IMPA, a correlation that has not been explored. Hence, within the limitation of the exclusion factors, the results of this study may apply to any individual case irrespective of his/her ethnic or racial background. Further, such studies on populations of different ethnicities will throw more light on the subject matter to substantiate or negate the findings of our study. This will broaden the diagnostic criteria for evaluation of IMPA and improve clinical application in achieving patient specific results.
Conclusion
There is wide variation in the IMPA across the populations of different ethnicities and within as well but there is no satisfactory explanation for this variable finding. Even in a well matched samples, the variation ranges from 8-10 degrees from the average. No study has studied the correlation of IMPA with the mandibular ramus to base ratio and this study provides insight into this correlation. This finding of the study indicate that this is one of the most important parameters that explain the major and minor variations in IMPA. The unit increase in IMPA is significantly associated with a 0.004 unit increase in the ratio of ramus to mandibular base i.e. every 10 degrees increase in IMPA might be related to approximately 4 mm deficiency in the mandibular body length compared with the ramus length. Thus, the ratio of mandibular ramus to base hold great significance in planning the final position of lower inciosrs.
Declarations
Ethics approval and consent to participate
Consent taken from all the participant for including their photograph.
Authors' Contributions
First author – Conduct of study, literature review and data collection.
Second author – Original idea, Scientific writing and revision.
Source of Funding
None.
Conflict of Interest
None.
References
- CH Tweed. The Frankfort-mandibular incisor angle (FMIA) in orthodontic diagnosis, treatment planning and prognosis. Angle Orthod 1954. [Google Scholar]
- RM Ricketts. Planning treatment on the basis of the facial pattern and an estimate of its growth. Angle Orthod 1957. [Google Scholar]
- JA Mcnamara. A method of cephalometric evaluation. Am J Orthod 1984. [Google Scholar]
- Ae Orthodontic Athanasiou, Cephalometry. . Chicago: Mosby 1995. [Google Scholar]
- MB Atit, SV Deshmukh, J Rahalkar, V Subramanian, C Naik, M Darda. Mean values of Steiner, Tweed, Ricketts and McNamara analysis in Maratha ethnic population: A cephalometric study. APOS Trends Orthod 2013. [Google Scholar]
- D H Enlow, M G Hans. . Essential of Facial Growth 1996. [Google Scholar]
- DH Enlow, T Kuroda, AB Lewis. The morphogenetic basis for craniofacial form and pattern. Angle Orthod 1971. [Google Scholar]
- SP Singh, AK Utreja, AK Jena. Cephalometric norms for orthognathic surgery for North Indian population. Contemp Clin Dent 2013. [Google Scholar]
- R Garg, M Alexander. Are we similar to Caucasians": Orthognathic surgery for North Indians. J Maxillofac Oral Surg 2015. [Google Scholar]
- H Grewal, SS Sidhu, OP Kharbanda. A cephalometric appraisal of dento-facial and soft tissue pattern in Indo-Aryans. J Pierre Fauchard Acad 1994. [Google Scholar]
- Pr Moorjani. Genetic Evidence for Recent Population Mixture in India. Am J Hum Genet 2013. [Google Scholar]
- T Rakosi. . An Atlas and Manual of Cephalometric Radiography 1982. [Google Scholar]
- A Jacobson. Radiographic Cephalometry: From Basics to Video-imaging. Chicago: . Quintessence 1995. [Google Scholar]
- H Margolis. Axial Inclination of Mandibular Incisors. Am J Orthod 1943. [Google Scholar]
- CH Tweed. Frankfort Mandibular Incisor Angle (FMIA) in Orthodontic Diagnosis, Treatment Planning and Prognosis. Angle Orthod 1954. [Google Scholar]
- CH Tweed. The diagnostic facial triangle in the control of treatment objectives. Am J Orthod 1969. [Google Scholar]
- S ain, R Tondon, K Singh, R Kulshrestha, V Umale. Tweed's Philosophy-A Review. Indian J of Orthod Dentofac Res 2017. [Google Scholar]
- T Tikku, R Khanna, RP Maurya, SL Verma, K Srivastava, M Kadu. Cephalometric norms for orthognathic surgery in North Indian population using Nemoceph software. J Oral Biol Craniofac Res 2014. [Google Scholar]
- N Sahoo, R Mohanty, P Mohanty, T Nayak, SB Nanda, A Garabadu. Cephalometric norms for East Indian population using burstone legan analysis. J Int Oral Health 2016. [Google Scholar]
- C Gutermann, T Peltomaki, G Markic, M Hanggi, M Schatzle, L Signorelli. The inclination of mandibular incisors revisited. Angle Orthod 2014. [Google Scholar]
- SZ Nazir, M Mushtaq. Frankfort Mandibular Plane Angle (FMA) and Lower Incisor to A-pog distance, and their relation in Different Skeletal Classes. Int J Appl Res 2020. [Google Scholar]
- Introduction
- Materials and Methods
- Results
- Comparison of IMPA and the ratio of ramus to the mandibular base with the reference standards. [[Table 1]]
- Correlation analysis of IMPA with the ratio of ramus to the mandibular base. [[Table 2]]
- The gender-specific linear regression analysis for the prediction of the ratio of ramus to the mandibular base using IMPA. [[Table 3]] [[Figure 4]]
- Discussion
- Conclusion
- Declarations
- Authors' Contributions
- Source of Funding
- Conflict of Interest